Thursday, December 21, 2006

Confluence- Ford Motor Co. (F)

I've been listening to Tom O'Brien for several months now and have learned quite a bit. He uses, among other things, the idea of confluence throughout his technical analysis of charts. He defines it as "the price range sandwiched between the 0.382 retracement level of a trend and the 0.618 retracement of a related subtrend; confluence reveals powerful support and resistance level."

The method is used to find entry points and help establish stop loss levels. I'll use an example of a stock that I have wanted to short for a long time but didn't have the right entry point. Ford Motor Co. (F) is dying and I would like to make some cash on that fact.

First, I need to set up the trend and subtrends. I chose to look at the long term downtrend of Ford. The analysis of the weekly chart revealed confluence to be at 7.88 and 7.66. (A1 = 10.87, A2 = 8.67, and Focus = 6.02) As it can be seen, the price already broke through confluence on high volume. However, three week ago, Ford took a nose-dive on huge volume and began an ABC down pattern.

Now, lets examine the shorter term chart. Ford established a new uptrend with a powerful ABC up that busted right through the downtrend confluence points. Ford then fell off the highs on big volume and then made another leg up to finalize a double-top pattern. Now Ford is in the midst of an ABC down, coming off the second high of the double-top on massive volume. This time, slicing right through the newly established uptrend confluence points (green lines). I expect that Ford will rise up to the C point in the ABC down and then continue down. The C point will most likely be between the long term down trend confluence points of 7.88 and 7.66 (red lines).

Vacation time

Time for a break. I gave back most of the gains I made with the MIND trade by going short too early (again). Will I ever learn? I must be patient!!! In the meantime, I will continue to watch for a break down in our leaders and keep my eyes open for short setups.

Now I'm off to the OC. It will be nice to see the family but Orange County, CA can be hard to take sometimes. Thank God Becky is going to help me through the madness.

Thursday, December 14, 2006

Flotek Industries


After a little consolidation, Flotek resumed its upward march the last couple of days. Today was a technical breakout from a cup with handle base. The 50% correction of the last few months was pretty severe, usually a good base should only correct by 30-35%, but all signs point to higher levels.

  • The 50 dma crossed the 200 dma.
  • IBD ranks FTK in the top 5 of the Oil&Machinery/Equip Group.
  • Someone said that it is VectorVest's #1 stock pick. (who cares)
  • A+ Accumulation rating
  • 96 Relative strength
  • This all adds up to more exposure and higher prices.
What more can I say about FTK that I haven't said before. This was a no brainer down at the $15 and $18 levels.

Monday, December 11, 2006

I couldn't pass up the sell


Back on Nov 29th I picked up some shares of Mitcham Industries (Mind) for $12.01. I did this as the stock pulled back after a modest breakout. Earnings came out today and the stock was up to $15.50 in pre-market trading. The only problem was, this huge jump came with only 5,000 shares of volume. I know pre-market is not very liquid, but only 5000? A quick check of the earnings report showed that earnings were good but certainly not great. I sold right when the market opened.


It turned out to be a pretty good move. Check out the chart.

Thursday, December 07, 2006

Identify the leaders (because they lead us down)

Today was the first day in a long time when the Nasdaq and S&P ended the day at the lows. It made me think back to earlier in this rally when my mom called just after the Dow hit new all-time highs and expressed some worry about my investments. The market was strong and seemed to end strong on just about every day. I told her that she should only start to worry when the market stopped acting this way and began to close sharply down.

The top is near! We picked up another distribution day today (3 on the nasdaq) and if we pick up another two in the next couple of weeks we will finally have that correction that I've been waiting for. I'm the novice bear, after all.

My game plan. First identify the leaders of this rally. Short the hell out of them when they break their 50 dma. Look for short-covering rallies and add to the short position.


Current Leader

US Global Investors (GROW) is one that is extended so far past its 50 dma that by the time it crosses the 50 dma it might be too late. GROW has a pretty big intraday reversal today and will stay on my radar screen. The big reversay might have been due to an Investors.com piece on the dangers of buying a stock that is technically extended.

Bottom line is that I'm not going to jump in too early. I'm just going to be ready to jump in with both feet.

Monday, December 04, 2006

Volume dries up in the QQQQ and the DIA


The price and volume in the DIA and QQQQ diverged quite a bit today. This is the first time that I have seen such a large drop off in volume while getting such a large move in price. (Remember, I'm relatively new to the markets.) The volume in the Nasdaq composite and NYSE were not quite as weak, which begs the questions: Who was it that decided that they

didn't want to participate in today's rally? Who are the stock operators that usually trade the q's, the SPY and the DIA? Are they the smart money? Do they know something? Is this just a blip on the radar or a harbinger of things to come? We shall see.

Sunday, December 03, 2006

ProShares Ultra Short (QID)


If you didn't know, there are ways to short the overall market without actually shorting the SPY, DIA, or QQQQ. All one has to do is buy the Proshares Ultra Short ETFs.


QID = Nasdaq
SDS = S&P 500
DXD = The Dow

The advantage (or risk) is that the ETFs will move twice as much and in the opposite direction of market it follows. The nasdaq goes down 1% and the QID goes up 2%. I bought some of QID shares on Friday.

Window dressing

Through listening to Tom O'Brien I have come to learn about "window dressing". This is the time when money managers pump up winning stocks in order to make their performance look better, although somewhat artificially. If I'm not mistaken, this usually happens at the end of the month.

I just read a fascinating article by the guys at TradingMarkets.com. They did some back testing regarding the end of the month rallies and came to some very interesting conclusions.

Tuesday, November 28, 2006

Get inside Cramer's head

Scary thought I know. You have to read the exchange between CXO Advisory Group and Jim Cramer. It is well worth your time.

Cramer is easily the most inconsistent "pro" out there and it doesn't take long to figure that out. What I find so strange is that he seems to be the only one who doesn't realize it. To his credit, he seems to have stopped recommending thinly traded stocks that move wildly in after-hours trades.

Exciting technicals - Mitcham Industries (MIND)

Most of the stock screeners out there are really geared towards the mid- and large-cap equities. It is hard to find a screen that allows one to discover new and relatively unknown stocks.

My favorite is the MSN Money stock screener. I have a CANSLIM screen for the fast growing companies based upon the criteria of William O'Neil. I also have a screen that I came up with that has the purpose of spotting stocks with increasing revenue but rather weak stock performance. It was basically modeled after the recent behavior of Flotek Industries. Durning the course of Flotek's growth, it was hit with a massive increase in its tax burden. The revenue was still growing (100% year of year), it was the EPS that went flat. As a result, the stock price took a nose dive.

The charts on the left are a daily, weekly and monthly of Mitcham Industries Inc.. This stock popped up on my simple revenue screen with the following numbers. They lease seismic survey equipment.

Rev. growth Qtr vs. Qtr - 56.50%

Rev growth Year vs Year - 31.20%

Return on Equity - 26.49

EPS Growth YTD vs YTD - 38.80%

Gross Margin - 64.30


Well, those are the fundamentals. What I'm excited about is the technicals. I've been watching for a while now and today we had a breakout today on pretty good volume. This is coming off of another breakout on November 15th that broke a long term downtrend channel line going back to Feb 2006. (See weekly chart) The really cool thing is the long term pattern. Look at the nice ABC pattern that is taking shape on the monthly chart. The A point is way down at 0.870. The stock then makes a huge run in three years to the B point of 26.18 (It finished with a climax top). The stock then retraces 61.8% to the C price point of around $10.

My price target is $25. If the stocks picks up some volume as it nears the highs (26.18), hold on to your horses because this might just go a lot higher. It will have to get more than 8 million on the monthly or 2.8 million on the weekly.

Monday, November 27, 2006

Sit back and watch

Big drops like today are so much easier to take when one has money on the sidelines waiting to be put to work. Unfortunately, some of this money was put to work a little too early. I had put in an order to buy Lam Research Corp (LRCX) after the recent breakout last week. I was down in the lab all day and didn't see the big sell off today. Needless to say, my limit order was filled at 54.05. Oh well. I put in a stop loss at 51.90. I doubt it will hold. It looks like we are in for a nice pullback and LRCX is bound to get a lot cheaper.

Flotek (FTK) dropped less than 1% on very light volume. Very Bullish. I'm tempted to buy more very soon.


AllianceBernstein (AB) pulled back 2.56% on moderate volume. It looks like it might get down to area 72.50, where there is nice support. The bullish sign for AB is found in the 5 min chart. It make its largest price decline on the lowest volume of the day and then rebounded somewhat on heavier volume. I like that.


Gold is up nicely the last few days. I originally purchased shares of the gold ETF because I'm worried that inflation is worse than is generally accepted. The dollar weakness has definitely helped this position.

Monday, November 20, 2006

Bottom Feeding with GNSS


Because I'm looking for a market decline I'm on the lookout for stocks that are already near their bottom and also near support. Check out Genesis Microchip (GNSS). I give the daily and weekly charts. The price is very near long term support at just under $10. We also had a climax bottom on Oct 25th, which usually means that all the sellers are gone. If GNSS continues down to the support line on low volume I think I'll pick up some shares.

Finally, I closed my ECIL short a 7.80 today. It wasn't doing what I predicted so I got out with a very small gain. Better than a loss, eh? Especially considering it got up to $8.15 later in the day.

Jim says "buy, buy, buy!!!"


Like I said in my first post, there are enough Jim Cramer bashing blogs out there already and the world doens't need another. I would bet that without Cramer there would be some blogs with posts that are as sporatic as mine. With that said, I noticed a couple of big-time sell signals today on RealMoney.com. The first takes advantage of Cramer as a contrarian indicator. Today, when the market dropped, he called for people to "Shop this Dip". Uh oh, sounds a lot like the calls Jim made back in May. The second came from a word of caution from Cody Willard, who called the top back in May.

Looks like that pullback that people have been looking for might be just around the corner. I hope so, because I want to put some money to work.

Saturday, November 18, 2006

Correction


I was in the bookstore last night and was reading a tech. analysis book by the guy who invented the MACD indicator. He pointed out that the VIX is useful for calling bottoms but has found no correlation between the market tops and extremely low volatility.

Today I also found an interesting link on The Big Picture's linkfest. It was an article by Mark Hulbert, whom I read regularly, so I was surprised that I missed it. "How low can it get?"

Finally, if you didn't know, anyone with an email ending in .edu can get a free RealMoney.com membership until March 07. Pretty cool, as long as one ignores that Jim Cramer guy. I like Rev Shark and Cody Willard, but don't pay attention to the technical analysis guys. They really suck. I don't see many post by Barry Ritholtz anymore. Too bad, because he used to be a nice contrast to all of the perma-bulls on the site.

Friday, November 17, 2006

This all very interesting...but


This market is maddening!

With some money on the sidelines, I have been looking to enter new positions ever since the S&P 500 was at 1320. We are at 1403! If I'm feeling this way, just think about the people who have been 100% in cash for this whole run. Now I understand why people say that we hit the top when the bears finallly capitulate. When they finally say "screw it" and jump in on the long side there will be no where to go but down.


I'm like to remind myself of a Jesse Livermore quote when I'm having trouble being diciplined.

“After spending many years in Wall Street and after making and losing millions of dollars I want to tell you this: It never was my thinking that made the big money for me. It always was my sitting.”

Friday, November 10, 2006

I'm learning my ABC's


In a market when all of the leaders have broken out of bases, like now, it is useful to look for patterns that can give clues to making shorter term trades. I've been reading a lot recently on Elliot Wave "theory" and have decided to test it out. Elliot wave uses Fibonacci's golden ratio to predict the future price of stocks, bonds, commodities, etc.

Tom O'Brien talks a lot about the ABC structure based upon the Elliot wave, but as usual, he adds price and volume action along with the ABC. I've been watching tons of charts and it looks like ECIL is worth a try. Looking to the chart in June and July, Ecil completed two ABC down structures. Notice the fractal nature of the ABC's. After these moves down, Ecil rebounded on relatively weak volume and then took a big hit on big volume in October, forming another A to B price movement. The price then retraced to the first Fibonacci level of 38.2% of the A to B leg, on much lighter volume. The price looks to have stalled and we should now begin the B to C movement down on higher volume, with a price target of < $6.

I'm sick of spotting these charts, predicting the move and then not having any money in the stock. Well, not here. I shorted Ecil yesterday at $8.90. I still expect an overall market decline, so this short position should put me in good position for the pullback.

Monday, November 06, 2006

QQQQ trade

Holy cow! Looks like today's rally didn't just catch me by surprise. I closed that QQQQ trade early this morning and took solace in watching FTK rise another 12%.

Saturday, November 04, 2006

A little publicity

FTK shot up another 11% yesterday thanks to some exposure by Jon D. Markman.

He is looking for Flotek to hit $40 in the next 18 months. He is probably being conservative. If they come through with another big quarter I would expect FTK to reach $40 within 6-8 months, depending on how many momentum players jump on. Also, we should expect some analyst coverage soon.

Friday, November 03, 2006

QQQQ Puts


I went and did it. The maket opened up this morning and I just couldn't resist buying some in-the-money QQQQ Jan 07 puts. I'm looking for a pullback to the 39-40 level.

Wednesday, November 01, 2006

Another great call by Mr. O'Brien

It looks like the pullback has begun. So what did I do today?

First, I sold out of DIOD at 43 this morning. It was lagging and considering the action today I really didn't feel like holding on to it during today's earnings announcement. It turned out to be a good decision. DIOD tanked later in the day and didn't bounce very much after it reported great numbers.

AllianceBernstein (AB) hit a new 52-week high and then backed off slightly. I really like the way this one is acting. I will hold onto this one and will probably add more shares if the market weakness brings it down.

Flotek Industries (FTK) What can I say about this one. I've been through hell with Flotek and certainly won't be shaken out with a little market weakness.

I was one click away from buying some qqqq March '07 puts at the 44 strike price. I probably should have but just didn't have the guts. If the market opens up big tomorrow I still might make the trade.


Instead of buying puts I decided to buy some of the gold ETF (GLD) as a hedge against the market decline. Why? Check out the chart. Gold broke out of a symmetric triangle pattern. Also, 'ol Tom O'Brien has been preaching about gold for a long time and today looks like a great entry point.

Tuesday, October 31, 2006

Short the SPY


In my quest to become an expert investor/trader, I have tried to read and absorb as much information as possible. My plan is to have a working knowledge of most of the styles out there and pick and choose the parts that I feel most comfortable with.

In general, I feel most comfortable with technical analysis. As a "little guy" without any access to all of the information the big time stock operators have, I have little chance of being a successful value investor. I feel that my only hope is to watch how how the real stock operators move the market and jump on board as they push the markets up or down. What use is an undervalued stock if no one with the ability to move that stock cares to move it?

There are many different ways to watch charts. I have learned that any good chart analysis must begin with the relationship between price and volume, which is the method at the heart of Bill O'Niel's tech analysis. Basing buy points on chart patterns only, without volume consideration, is quite dangerous. (Like most beginners, I learned this the hard way.)


The CANSLIM method of Bill O'Niel is great, but it is for relatively long term investing and it requires one to buy stocks that are making new highs. I wanted a method to compliment this investment style with a more short term, bottom fishing technique. I have found exactly that with the Tom O'Brien radio show. He is an expert price and volume technician who's radio show can be found at TFNN.com. He also has a book that is a little on the basic side but still is useful. I originally learned about him through IBD and the monthly interviews he has with Bill O'Niel.

Tom O'Brien compliments his price and volume style with Fibonacci analysis, swing points, and candlesticks. He called the bottom of July and has been right on just about every call since (well at least for as long as I have been listening.) Right now he is calling for a medium sized pullback in the general market, with the S&P 500 falling to around 1320. I have some cash in reserve that I've been waiting to put to work and plan on doing so if his prediction proves correct again. Hell, I might even short the SPY or DIA for a quick trade. I must make my decision soon because when these corrections come, they come hard and fast.

Wednesday, October 25, 2006

Flotek and a warm fuzzy feeling...


Would I feel as good as I do right now if I didn't have to experience the pain of a near 45% decline in my shares of Flotek Industries? Maybe...well probably.

Perhaps the real questions is: would I have held on to the shares of any other company experiencing such a dramatic decline? Hell no! I'm not supposed to hold losses past 10%.

Forget all of Flotek's proprietary chemicals or its patented petrovalve, the real asest of Flotek industries is Jerry Dumas, Sr. His honesty and confidence comes roaring through every presentation and conference call I've listened to. He isn't afraid to tell the truth and also isn't afraid to get angry, both at himself and at the market. I admire the man very much and want to thank him for the great job he has done. I was very close to selling my entire stake in FTK at the absolute lows, just because I couldn't take the pain anymore. But after listening to their Q2 conference call several times, the enthusiasm of Mr. Dumas renewed my resolve and I doubled down instead.
Thanks again Mr. Dumas. It looks like the market is finally waking up to your company's growth. I've seen posts on Marketgainer.com and Streetinvesting.com about the amazing moves that are being made by FTK.

Tuesday, October 24, 2006

Jerry comes through


It has been a long ugly ride but it looks like we can finally say goodbye to the lows for Flotek Industries. On the last conference call management confidently provided very high guidence for revenues and it looks like they came through, big time. Sales are up, margins are up and, best of all, earnings are up. If this is what being a value investor is all about, I'm not so sure my stomach can handle it.


They have their Q3 conference call on Monday. More good news to come, I hope.
On another note, my previous thesis about shorting the cyclicals is dead and buried. X, FCX, PD, ect. are all up huge today. This is on top of some previous strong moves. I have no short positions and haven't had any for a long time. It might be time to change the name of the blog?


Sunday, October 15, 2006

PCE vs. The Dow

I would like to start off by saying that I'm not an expert in the field and I'm just presenting this data for my own good. Ok, with that out of the way I'll get down to business.

I was interested by a post on The Big Picture in which Barry Ritholtz asks, "Where are the Bears? (And why are the Bulls so insecure?)". It got me thinking about all the people out there who are predicting a massive collapse of the market (you can usually find these people posting comments on Barry's blog). It seems clear to me that we will see a pullback in the market, but a collapse? Usually these gloom and doom comments I read are based upon macroeconomic arguments or have some political bias, like George Bush is leading this country down the toilet. Now I happen to agree that Bush is an incompetent president that will go down in history as one of our worst, but I also believe that the United States is resilient enough to get through this dark period. Ok, before I really start ranting I'll get back to the question that I started out to answer for myself, namely, does the macro argument really matter?

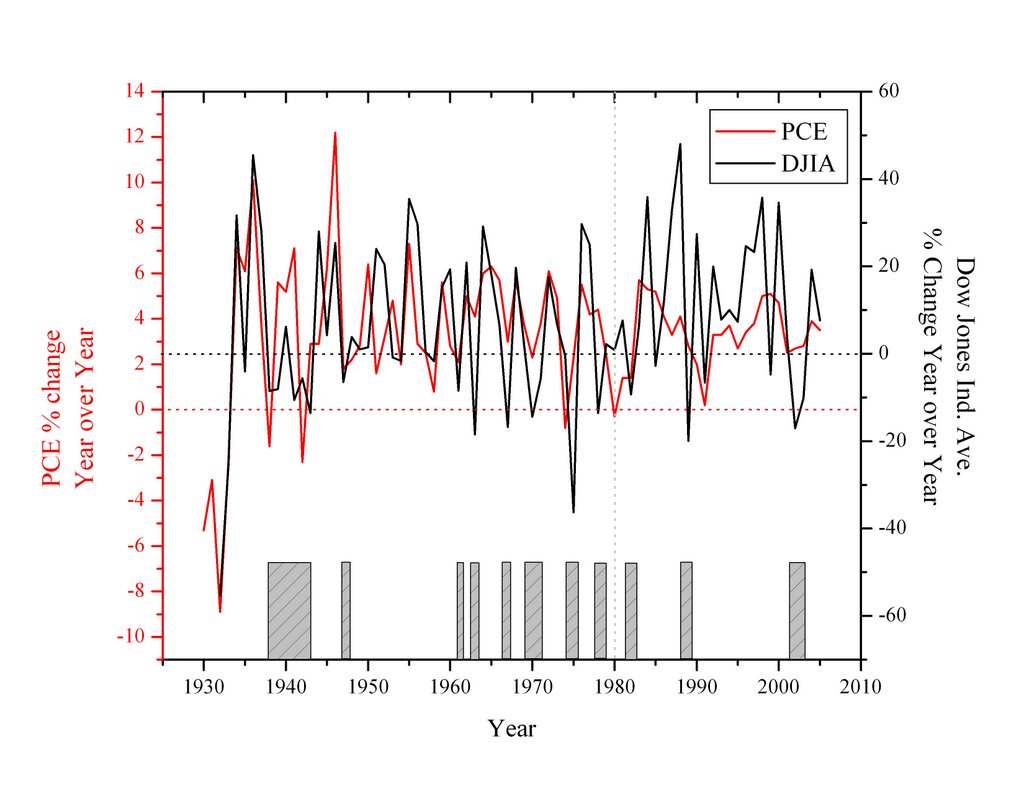
The book "Ahead of the Curve" (recommended by Mr. Rithotz) analyzes the relationship between the economy and the market. The author, Joseph Ellis, basically narrows it down to the consumer. The relationship between the real personal consumption expenditure (PCE) and the market can be found on Ellis' webpage.


The relationship between economic slowdowns (led by downtrends in year-over-year consumer spending) and bear markets (vertical yellow bars) is remarkably consistent, though not infallible, over many cycles. Most bear markets begin (see circles) when the year-over-year rate of growth in consumer spending is peaking, and investor and general business optimism are at their highest! Considerable courage is required to reduce investments at such times.

For my own learning purposes I reproduced the chart using the year over year percentage change in the PCE and the year over year percent change in the Dow Jones Industrial Average. Using the data from the Bureau of Economic Analysis I was able to plot the relationship all the way back to 1930. The red line is the PCE and the black is the Dow. The grey blocks at the bottom of the plot show bear markets and were defined by negative percent changes in the Dow.

What is clear is that, indeed, there is a good correlation between downturns in the PCE and downturns in the Dow, up to a point. It seems that the correlation begins to wane after 1980. To get a more quantitative handle of this correlation I've also plotted the Dow vs. the PCE for the periods 1931-1980 and 1980-2005 and fit them to line. The R value in the plots are from the linear regression and is just a simple statistical tool for quantifying the degree to which two variable are correlated. A value of 1 means that they are totally correlated while a value of 0 means that there is no correlation.

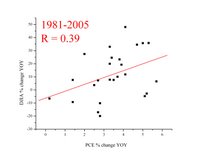
As you can see, the period between 1931 and 1980 has a relatively high R value (0.62). Conversely, the period between 1980 and 2005 has a much lower R value. So what does this mean? Clearly, the use of the PCE as an indicator to where the market is headed is not a good as it used to be. Of course a total collapse of the consumer will result in a downturn, but it is not clear to me that a decrease in PCE growth will lead to a market downturn. All you have to do is look at the early 90's for an example.

Another point I think that is worth noting is the low growth rates we are currently at. We are certainly not at the extreme PCE growth levels that were seen in the boom and bust cycles of the past.

Conclusions:
  • The relationship between the PCE and the equity market is not a strong as it used to be.
  • It is dangerous to base opinions of market direction solely on macroeconomic data.
  • My opinion is that we are overdue for a pullback, but we are not looking at a crash.
  • I'm looking for a S&P 500 pullback to the 1320 level.
  • I'm probably wrong!

Thursday, October 12, 2006

Sigma Designs

I posted a little something about Sigma Designs recently and remarked about how I liked the chart setup as well as the 25% short interest. I was waiting for SIGM to pull back a little and fill its gap but it didn't cooperate.

Yesterday SIGM exploded. Today it looks like the shorts are still trying to cover. This thing is up 25% in one and a half days. I hope it doesn't run too much because I would like to see a moderate pull back on lighter volume so I can get in. Doesn't look like it will happen though.

Wednesday, October 11, 2006

I'm getting superstitious.


I haven't posted any buys that I've made recently because it seems like the market has been on a roll and I didn't want to jink anything.

I bought AllianceBernstein (AB) and Diodes Inc. (Diod).

Two days after I bought AB, someone downgraded it and it dropped some. It wasn't alot and I decided to hold on and see what happened. Today Goldman Sachs gave it a big upgrade and it looks like my patience has paid off. Did I mention that AB pays a 5% dividend?

Diodes Inc is a massive growth story. I'm late to the game but many think that there is still plenty of upside. I bought it when the chart closed the gap the other day. The big drop on high volume was caused by the company anouncing that they would take on 200 million in debt for possible acquisitions. They will only be paying 2.25% in interest for the loan, which is due in 2026. You can get savings accounts with higher rates than that.

Tuesday, October 10, 2006

Upcoming Earnings for Flotek Ind.

Yes, that's right...I'm talking about FTK again. We are seeing the accumulation of the stock prior to earnings again. Remember that management has made some pretty big predictions about earnings for the second half of the year. The money coming in and out of the stock makes me think that someone is accumulating while someone else is still pissed about management's mistakes this past year.

I have been complaining about some seller out there continually pushing the stock down with 1k block sales. On Oct 4th there was a huge trade (huge for FTK) for about 25k and ever since it looks like someone is accumulating rather than the previous distribution. I keep seeing bids at 14.50. We have seen this before and it seems to come just before earnings. Someone has to be willing to sell at these low prices and I think it is because that they are still mad about the big acquisition that fell through earlier in the quarter. Good riddance. This stock is at a bottom and has nowhere to go but up.


Here is a chart. Look at the flat, small spread periods of accumulation prior to earnings. The technical indicators pick up on this a little bit. I'm not a big candlestick guy, but look at the Morning Star reversal pattern at Sept 18th. I also point out the time when FTK cancelled its ENERCOM presentation because doomed negotiations were still going on. That was a big mistake!!!

Tuesday, October 03, 2006

I don't understand this chart


Yesterday I posted some remarks about the lack of small and micro cap participation in this "rally". I wanted to follow up the post with a chart of the AMEX composite.

This chart look ominous. The weekly tried to make new highs on dramatically smaller volume, then turned down and now has broken the 40 week moving average. Overall, the AMEX looks to me like it has put in a double top.

What the heck does this mean? I have no idea and I can't seem to find any information about it either. All I know is that the AMEX has made a fantastic run in the last few years and it looks like the good times are over. Will the NYSE and Nasdaq follow? We shall see, but I'm going to continue to be cautious.
Go Dodger Blue!

Monday, October 02, 2006

Bear is back?

All the people that I read have been calling a top, at least for the short term. Most are pointing to the divergence between the large and small cap stocks. A great synopsis of the behavior is given by Asbury Research. Basically, the money moves to large, less risky stocks before a big slowdown in the economy.


Here are some of my charts. First is the S&P 500. Everything looks great. It is back above the trend line and its 40 week average.

Not so pretty are the small caps. Here I show the Russell 2000 growth ETF and the S&P 600. Both of these guys are still below their trend lines and seem to be having trouble breaking through.

So what am I gonig to do about this? My plan is to be a little more cautious for the time being. I also will keep a close eye on my long positions and not be afraid to close them before if they break to the downside. I'm also going to keep my eye open for some good shorts. This market just sucks and I'm starting to think that I should just wait for another big downside move before I buy again.


On a political note, I'm getting pretty tired of people saying that the market is stalling because the democrats might win congress back. What a bunch of crap!

Saturday, September 30, 2006

Bulls vs. Bears

Since I am relatively new to the market I do not have any experience with this particular portion of the economic cycle. I keep hearing and reading two arguments that both make sense to me. First, is the obvious fact that if there is a general slowdown in the economy there will be a corresponding slowdown in corporate earnings, thus lowering stocks prices. Now there are many arguments about how severe the slowdown will be, but generally I think everyone agrees that there will be a slowing of the economy. The other side of the argument is that the macroeconomic picture doesn't mean a damn thing to where the stock market is going. Basically, by worrying about the doom and gloom will prevent one from participating in large market moves to the upside.

What does a small, inexperienced investor like myself do? Right now, I'm not sure. I would feel a whole lot better if the small cap growth stocks would perk up. I think this is my major concern. Should I stay long with these small caps, which offer a huge upside, or do I shift my money into a large cap ETF like the DIA or SPY?

My strategy for now is to hold on to my long positions and keep a close eye on their behavior. This time I will make sure the stocks give clear sell signals before I sell.


From the world of sports, the Dodgers clintched a playoff spot today! I just hope Nomar gets healthy before the playoffs begin.

Friday, September 29, 2006

An actual post


I haven't posted for some time, but considering I was engaged recently I'm sure you can understand.

I'm concerned about the performance of small cap stocks relative to the broader market. I'm not sure what is going on but the small caps are really lagging.

For you contrarians out there, here is a survey of top financial blogs and what they think about the current market. Looks like everyone is looking for this to be a top. I'm not so sure. Next week should be interesting.


Monday, September 25, 2006

Great Weekend


On Saturday, Sept. 23rd, Rebecca Wolfe and I were engaged to be married!


Thursday, September 21, 2006

Are you watching NGPS?

Oh the pain! Being stopped out of my NGPS by a stinking nickle is feeling particularly nauseating today. Right now it is up over 7%.

I will never use a stop-loss order again.

Tuesday, September 19, 2006

Reading the tape


One thing that Jesse Livermore was always known for was his ability to "read the tape". When he was interested in a particular pivot point trade he would sometimes put out a huge buy(or sell) order and see how fast the shares were gobbled up. The orders would help him determine the demand for the stock and give him an idea of the path of least resistance, as he would put it.

The day after I posted my "watch list" I had some time at my desk and was watching the price movements of Silicon Image Inc. The price pushed towards $13 and I saw some big time ask orders being swallowed up without any problem. I'm no Jesse Livermore, but I was instantly reminded of his descriptions of tape reading and felt that the path of least resistance was to the upside. I started a position just under 12.90. As the chart shows, the stock declined and tested the 12.25 pivot point on lower volume. Looks to me like the path of least resistance is to the upside. On a strong move up I will add to my position.

And another thing, looks like I'm not the only one watching SIGM. Michael Ashbaugh posted a very similar analysis of SIGM's technicals today on MarketWatch. Looks like I might be learning something.

Update: I'm watching SIGM again reach towards new highs. It looks like there is still some overhead resistance at soon as the price reaches 13.05 and above.

Sunday, September 17, 2006

Some very interesting setups and breakouts

The HDTV and VOD (video on demand) sector is really perking up. You've probably heard about this being the next big thing and I tend to believe it. Is now the time to get into these stocks? Since I don't have the ability to call these CEO's and ask them personally, I have to rely on the charts and let them speak to me.

First, check out Silicon Image, Inc. (SIMG), which is pictured above. The weekly is above the daily chart. I've been reading more Jesse Livermore lately and he always emphasizes buying at pivot points. SIMG just broke through a major pivot point recently, with big time volume to boot. The overhead resistance at 12.20 has been pretty strong since May 2005. The price is now testing the breakout point on smaller volume. If it holds on weak volume I think that I'm going to jump on board. The balance sheet is solid and earnings are gaining momentum. Another thing going for SIMG is the fact that it went public in the last 8 years. Willam O'Niel has found that most big winners have made their largest moves within the first 8 years of its IPO.

For some reason I went to the Yahoo message board for SIMG. The first post I read was some dude bragging about shorting SIMG at 12.96. Wow, does this guy have any clue whatsoever? It has to be a bullish sign though.

Speaking of shorts. The next stock I've been watching, which has almost 26% of the float shorted, is Sigma Designs, Inc (SIGM). (No I didn't find it because of the similar ticker.) These guy's fundamentals are really improving and if VOD really takes off, SIGM will be a huge beneficiary. The chart is working on the right side of a base and might be in the early stages of forming a handle. This will be tough to buy at the correct point because I think the large short interest will cause an explosion in price when(and if) it finally does breakout. This reminds me of another piece of advice Jesse Livermore gave. "Don't anticipate market moves with your hard earned cash." It is important to be patient and wait for the proper pivot point. It is ok to anticipate moves in your head, but that is it. What I think will happen is that it will form a handle and move, on light volume, down to the gap at 12.50. It is there that I think the breakout will begin. I intend to catch that breakout.

Finally, there is SeaChange International, Inc. (SEAC) . It is in the same sector and has a very similar chart. I'm looking for SEAC to react in a similar manner to SIGM. I'm looking for it to consolidate on weak volume and fill the gap between 8 and 8.25. I want to catch the breakout.

Friday, September 15, 2006

Help me Bill!


I'm pretty discouraged about my recent buys. First of all I wasn't patient with DRIV and dumped it WAY too early. Second, I was stopped out of my NGPS position while flying to San Francisco when my trigger price was exceeded by a friggin' nickle. The stock then had a 6% bullish reversal in the second half of the day.

I'm writing this blog for one simple reason. All of the great traders would record their market operations and analyze their successes and mistakes.

Let the analysis begin.

First, I have to ask the question: why did I sell DRIV? Did the base pattern fail? No. Did the market go into a downturn? No. Did the stock fall below 7% of my buy point? No. The only reason I sold it was because I didn't see any leadership. For instance, the dow and nasdaq were moving up, but the IBD 100 was falling. Usually the IBD 100 should be leading the dow and nasdaq. What is my reanalysis? I think it is pretty clear that the reason why the IBD 100 was going down because the index was riddled with oil stocks and there has been a serious sector rotation out of those equities. Of course the IBD 100 is going to drop until the oils are purged from the index. Also, I didn't consider the fact that DRIV could actually BE a new leader.

As if to rub it in, IBD published a story in the "Investor Education" section that I probably could have used a week ago. It was entitled, "Most money is made by waiting, not trading", which is a quote from Jesse Livermore. Basically it was about being patient and not selling too soon.

The NGPS sell was just unlucky and now I realize why so many great traders hate stop-loss orders.

So now what is my plan. First, and foremost is to not fight the tape. I have already started looking for good charts and proper buy points. I'm watching SIGM very closely. Most importantly, I'm re-reading some of Bill O'Neil's books (pictured above) and planning on not repeating my errors. Speaking of Mr. O'Neil, he will be on the Tom O'Brian show September 26th. You can listen to the podcast or just download the MP3 from the TFNN website.

Thursday, September 14, 2006


Check out this scary plot! You can find it and an interesting argument about the near future of stocks here.

Is the Dow going to 20,000 or does it move down to the lower channel line?

I talked to my girlfriend today and came up with a new deal breaker. No religious fanatics allowed.

Monday, September 11, 2006

Running list added

I have recently thinking about the kind of people I would like working for me when I start my own research lab and thought it might be fun to make a list of "deal breakers" that might disqualify someone from working for me. I realize that I should probably focus on the positive side of things, but I've always been in the camp of "it's not what you like, it's what you don't like that defines a person".

The inspiration of this came when watching something on cable news about September 11th conspiracy theories. I can't stand people who will not accept the most likely explanation of some horrible event and reach for an irrational fantasy to help their small minds come to grips with what they have witnessed. What really gets me pissed is when these nut jobs delude themselves into thinking that they are "questioning the system" or "thinking critically" about the conventional explanation.

I do have a caveat of course. If you are between the age of 15 and 19 you are given a free pass because, hey, even I had my "the CIA killed Jim Morrison" phase.

#1 No Conspiracy Nut Jobs

#2 No Only Children: They don't work well with others and I just don't trust them.

More to come...

My personal bear market

Ok, DRIV had a big day today and I feel lousy that I sold so quickly, but I simply can't get past the feeling that I need to be on the short side. I got into the market during a top and whether this is the beginning of the second down leg of a supercycle bear market or another bull market surprise remains to be seen (see The Big Picture linkfest), but I just can't feel comfortable being on the long side.

Now I admit that going long on stocks has gone against my overall market thesis and has probably resulted in a self fulfilling bad trade. Without the conviction, I have been easily shaken out of my positions, breaking Rule #8.

Conversely, every trade I've made on the short side has resulted in success. It seems that there are so many charts that are perfectly set up for a short there really is no need to consider long trades right now. I know that I've been harping on the steel industry, but I have been watching this sector for some time now and, according to Bill O'Niel's method, the right amount of time has passed for successful short selling (5 to 7 months after the peak). O'Niel also suggests waiting until the price rallies above the 50 day moving average three times before initiating a short.

I shorted US Steel on Friday at 60.45 after it dropped past the 50 dma and caught a huge drop by the entire sector today.

I will also be keeping my eye on some of the IBD 100 energy stocks. These charts are setting up nicely for some short positions. Check out Holly Corp (HOC), Diamond Offshore Drilling (DO) or Cameco Corp (CCJ).

Finally I want to thank Mr Barry Ritholtz again for helping me clear my head. His recent post about all the idiots who send him hate mail was a real help (read "Where are the Trolls?"). If only I had the bankroll that his trader friend had.

Friday, September 08, 2006

Follow up to the last post


I'm in San Francisco right now for a conference and to hang out with my girlfriend. Before the flight out I set a stop-loss on my NGPS position. I wasn't feeling too confident about the recent maket moves on low volume so I set it at 41.30.

While on the plane the stock dropped on fairly big volume. Guess where it bottomed? Yup, at 41.25 and I was shaken out of my shares. NGPS then went on to have a big bullish reversal. Chalk another one up to "live and learn".

I should never have set my stop-loss so tight.


This is no rally!

I know IBD says we are in a "confirmed rally" but the leadership sucks, breakouts keep failing and I'm feeling very suspicious about the low volume gains. I really like Novatel (NGPS) but I just don't feel confident on the long side of things right now.

I'm short US Steel and I'm looking for some more short opportunities. There are tons of charts that are setting up nicely for that. I just wish the market would pick a direction and go with it.

Tuesday, August 29, 2006

Digital River dumped

I sold out of my position of Digital River Inc. (DRIV). I just didn't like the price action. I know IBD says we are still in a confirmed rally but I just don't like all of the failed breakouts I'm seeing all over the place. We need some leadership!

I'm holding onto NGPS for now because it seems to be the only stock showing any strength lately. I'm also watching the steel producers for more short opportunities.

Update: 09/05/06 I'm an idiot and didn't give this one time. My weak hand was shaken out and now it is going up on big volume. Oh well, live and learn.

Thursday, August 24, 2006

Flotek Industries Conference Call


The picture to the left is Jerry Dumas, Sr. He is the CEO of Flotek Industries and he gave one hell of a Q2 conference call today. He fielded some pretty tough questions from some pissed off investors and handled every one with class and honesty. He even got a little indignant about the market cap decline his company has endured since the Q1 conference call. His commitment to his company's share holders was not only demonstrated when he pulled the plug on a recent acquisition, but was also quite clear throughout the call.

I think Mr. Dumas is one of the reasons why I was drawn to Flotek in the first place. I'm a CANSLIM investor and learned about FTK earlier this year through the CANSLIM Select stock screen at Investors.com. I made a mistake by not waiting for a proper buy point, but I can tell you this, I would have never held on to this stock this long if I didn't have absolute faith in Jerry Dumas' leadership and integrity.

Here's to you and your health Jerry.

Here are some call highlights

  1. Earnings guidance is still 1.35 to 1.45 EPS for the year. This means that earnings for Q3 and Q4 will be double that of Q1 and Q2.
  2. Sales for Q2 were 22 million. Up 78% from last year. Half of that was organic growth.
  3. Operating income was 30.7 million. Up 41%.
  4. Cash flow was 3.9 million compared to 2.4 million for last year and 2.7 million for last quarter.
  5. Revenue guidance has been revised from 79 million to 90 to 95 million.

Listen to the call and buy Flotek at these extremely undervalued prices!

Tuesday, August 22, 2006

Flotek cancelled conference call


Well it seems I was on the right track about the cancelled conference call I was worried about last week. It seems that Flotek has broken off negotiations for a new acquisition. I guess the talks went a little long and made the talk at the Enercom conference impossible. A fresh conference call will be this Thursday, August 24th.

I'm glad that Jerry Dumas (the CEO) had the discipline to break off the acquisition rather than pay too much. Looks like it is back to organic growth for a while.

Update: The conference call was fantastic! All my serious questions were addressed. I will write up a detailed review in the near future.