Tuesday, October 31, 2006

Short the SPY


In my quest to become an expert investor/trader, I have tried to read and absorb as much information as possible. My plan is to have a working knowledge of most of the styles out there and pick and choose the parts that I feel most comfortable with.

In general, I feel most comfortable with technical analysis. As a "little guy" without any access to all of the information the big time stock operators have, I have little chance of being a successful value investor. I feel that my only hope is to watch how how the real stock operators move the market and jump on board as they push the markets up or down. What use is an undervalued stock if no one with the ability to move that stock cares to move it?

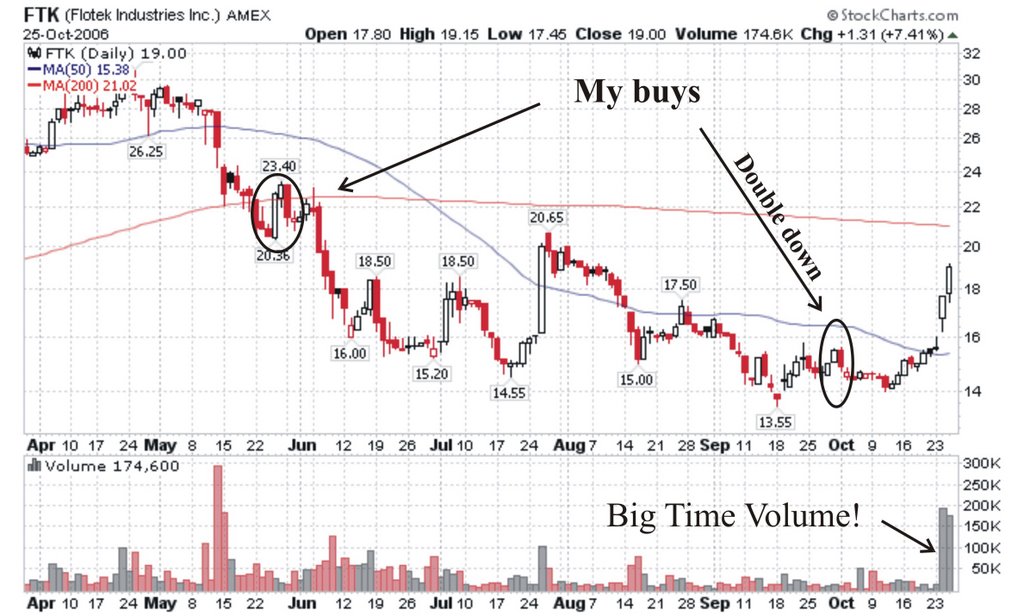
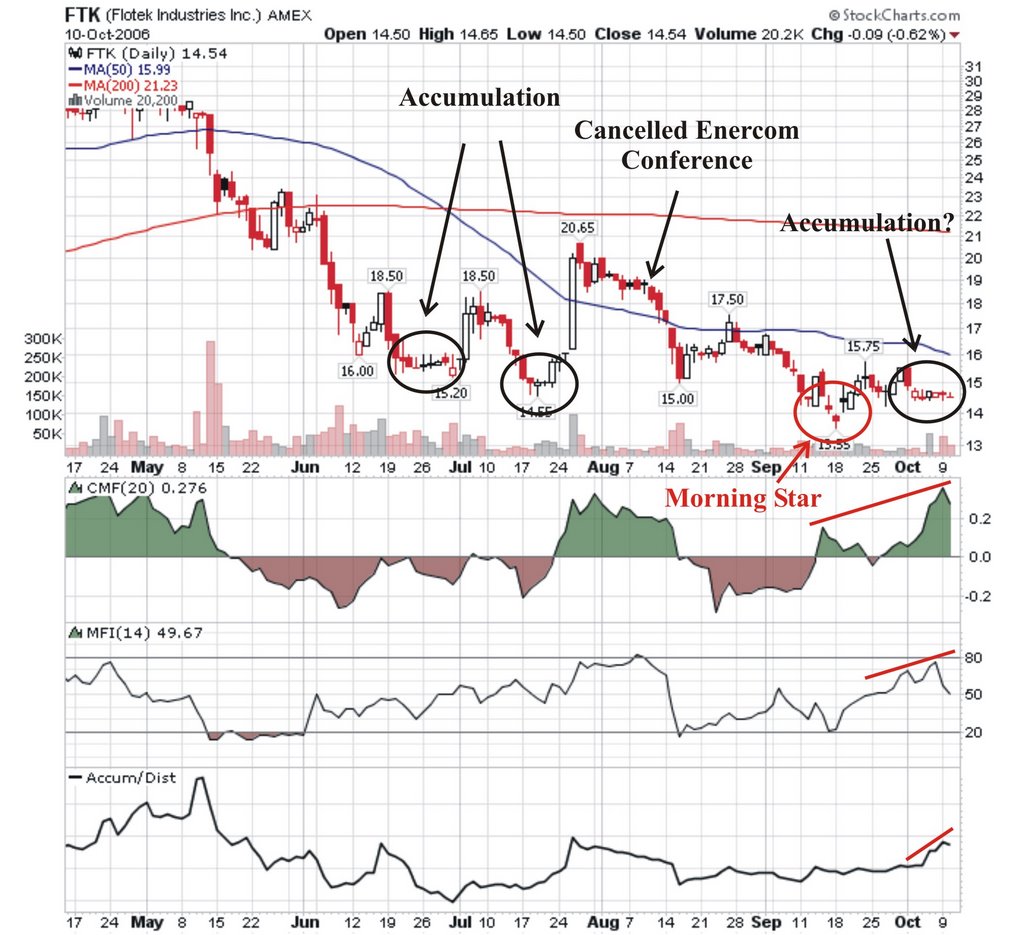
There are many different ways to watch charts. I have learned that any good chart analysis must begin with the relationship between price and volume, which is the method at the heart of Bill O'Niel's tech analysis. Basing buy points on chart patterns only, without volume consideration, is quite dangerous. (Like most beginners, I learned this the hard way.)


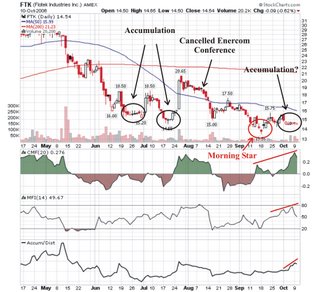
The CANSLIM method of Bill O'Niel is great, but it is for relatively long term investing and it requires one to buy stocks that are making new highs. I wanted a method to compliment this investment style with a more short term, bottom fishing technique. I have found exactly that with the Tom O'Brien radio show. He is an expert price and volume technician who's radio show can be found at TFNN.com. He also has a book that is a little on the basic side but still is useful. I originally learned about him through IBD and the monthly interviews he has with Bill O'Niel.

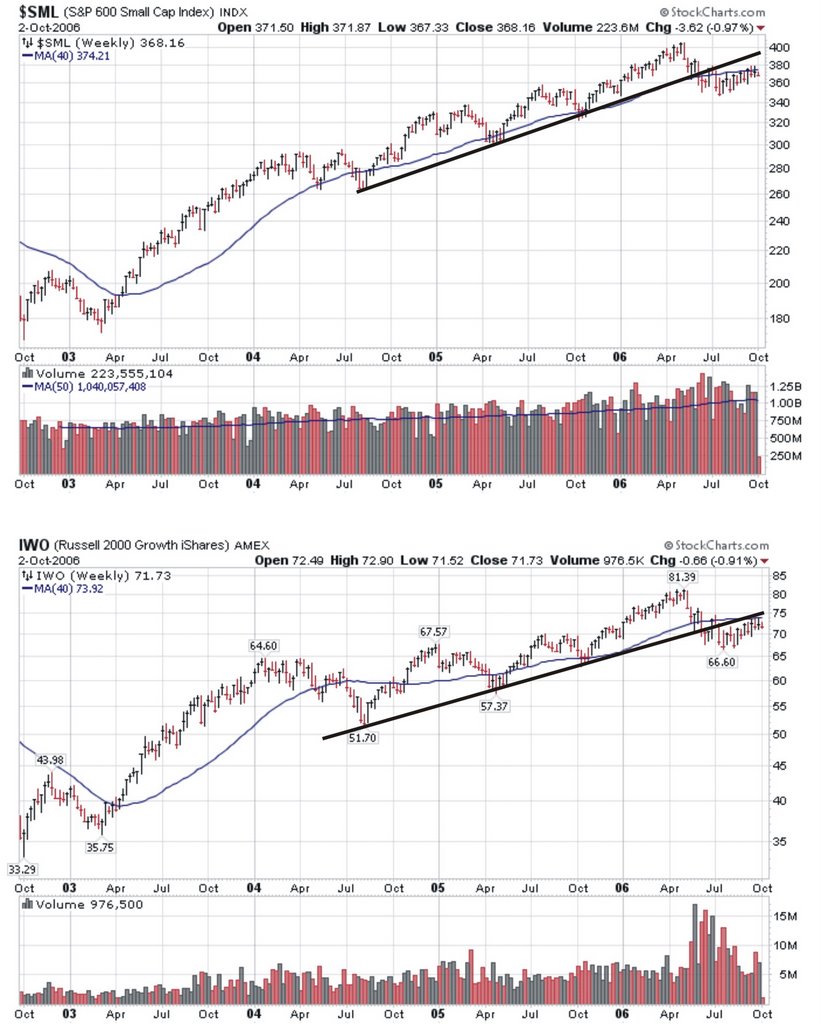
Tom O'Brien compliments his price and volume style with Fibonacci analysis, swing points, and candlesticks. He called the bottom of July and has been right on just about every call since (well at least for as long as I have been listening.) Right now he is calling for a medium sized pullback in the general market, with the S&P 500 falling to around 1320. I have some cash in reserve that I've been waiting to put to work and plan on doing so if his prediction proves correct again. Hell, I might even short the SPY or DIA for a quick trade. I must make my decision soon because when these corrections come, they come hard and fast.

Wednesday, October 25, 2006

Flotek and a warm fuzzy feeling...


Would I feel as good as I do right now if I didn't have to experience the pain of a near 45% decline in my shares of Flotek Industries? Maybe...well probably.

Perhaps the real questions is: would I have held on to the shares of any other company experiencing such a dramatic decline? Hell no! I'm not supposed to hold losses past 10%.

Forget all of Flotek's proprietary chemicals or its patented petrovalve, the real asest of Flotek industries is Jerry Dumas, Sr. His honesty and confidence comes roaring through every presentation and conference call I've listened to. He isn't afraid to tell the truth and also isn't afraid to get angry, both at himself and at the market. I admire the man very much and want to thank him for the great job he has done. I was very close to selling my entire stake in FTK at the absolute lows, just because I couldn't take the pain anymore. But after listening to their Q2 conference call several times, the enthusiasm of Mr. Dumas renewed my resolve and I doubled down instead.
Thanks again Mr. Dumas. It looks like the market is finally waking up to your company's growth. I've seen posts on Marketgainer.com and Streetinvesting.com about the amazing moves that are being made by FTK.

Tuesday, October 24, 2006

Jerry comes through


It has been a long ugly ride but it looks like we can finally say goodbye to the lows for Flotek Industries. On the last conference call management confidently provided very high guidence for revenues and it looks like they came through, big time. Sales are up, margins are up and, best of all, earnings are up. If this is what being a value investor is all about, I'm not so sure my stomach can handle it.


They have their Q3 conference call on Monday. More good news to come, I hope.
On another note, my previous thesis about shorting the cyclicals is dead and buried. X, FCX, PD, ect. are all up huge today. This is on top of some previous strong moves. I have no short positions and haven't had any for a long time. It might be time to change the name of the blog?


Sunday, October 15, 2006

PCE vs. The Dow

I would like to start off by saying that I'm not an expert in the field and I'm just presenting this data for my own good. Ok, with that out of the way I'll get down to business.

I was interested by a post on The Big Picture in which Barry Ritholtz asks, "Where are the Bears? (And why are the Bulls so insecure?)". It got me thinking about all the people out there who are predicting a massive collapse of the market (you can usually find these people posting comments on Barry's blog). It seems clear to me that we will see a pullback in the market, but a collapse? Usually these gloom and doom comments I read are based upon macroeconomic arguments or have some political bias, like George Bush is leading this country down the toilet. Now I happen to agree that Bush is an incompetent president that will go down in history as one of our worst, but I also believe that the United States is resilient enough to get through this dark period. Ok, before I really start ranting I'll get back to the question that I started out to answer for myself, namely, does the macro argument really matter?

The book "Ahead of the Curve" (recommended by Mr. Rithotz) analyzes the relationship between the economy and the market. The author, Joseph Ellis, basically narrows it down to the consumer. The relationship between the real personal consumption expenditure (PCE) and the market can be found on Ellis' webpage.


The relationship between economic slowdowns (led by downtrends in year-over-year consumer spending) and bear markets (vertical yellow bars) is remarkably consistent, though not infallible, over many cycles. Most bear markets begin (see circles) when the year-over-year rate of growth in consumer spending is peaking, and investor and general business optimism are at their highest! Considerable courage is required to reduce investments at such times.

For my own learning purposes I reproduced the chart using the year over year percentage change in the PCE and the year over year percent change in the Dow Jones Industrial Average. Using the data from the Bureau of Economic Analysis I was able to plot the relationship all the way back to 1930. The red line is the PCE and the black is the Dow. The grey blocks at the bottom of the plot show bear markets and were defined by negative percent changes in the Dow.

What is clear is that, indeed, there is a good correlation between downturns in the PCE and downturns in the Dow, up to a point. It seems that the correlation begins to wane after 1980. To get a more quantitative handle of this correlation I've also plotted the Dow vs. the PCE for the periods 1931-1980 and 1980-2005 and fit them to line. The R value in the plots are from the linear regression and is just a simple statistical tool for quantifying the degree to which two variable are correlated. A value of 1 means that they are totally correlated while a value of 0 means that there is no correlation.

As you can see, the period between 1931 and 1980 has a relatively high R value (0.62). Conversely, the period between 1980 and 2005 has a much lower R value. So what does this mean? Clearly, the use of the PCE as an indicator to where the market is headed is not a good as it used to be. Of course a total collapse of the consumer will result in a downturn, but it is not clear to me that a decrease in PCE growth will lead to a market downturn. All you have to do is look at the early 90's for an example.

Another point I think that is worth noting is the low growth rates we are currently at. We are certainly not at the extreme PCE growth levels that were seen in the boom and bust cycles of the past.

Conclusions:
  • The relationship between the PCE and the equity market is not a strong as it used to be.
  • It is dangerous to base opinions of market direction solely on macroeconomic data.
  • My opinion is that we are overdue for a pullback, but we are not looking at a crash.
  • I'm looking for a S&P 500 pullback to the 1320 level.
  • I'm probably wrong!

Thursday, October 12, 2006

Sigma Designs

I posted a little something about Sigma Designs recently and remarked about how I liked the chart setup as well as the 25% short interest. I was waiting for SIGM to pull back a little and fill its gap but it didn't cooperate.

Yesterday SIGM exploded. Today it looks like the shorts are still trying to cover. This thing is up 25% in one and a half days. I hope it doesn't run too much because I would like to see a moderate pull back on lighter volume so I can get in. Doesn't look like it will happen though.

Wednesday, October 11, 2006

I'm getting superstitious.


I haven't posted any buys that I've made recently because it seems like the market has been on a roll and I didn't want to jink anything.

I bought AllianceBernstein (AB) and Diodes Inc. (Diod).

Two days after I bought AB, someone downgraded it and it dropped some. It wasn't alot and I decided to hold on and see what happened. Today Goldman Sachs gave it a big upgrade and it looks like my patience has paid off. Did I mention that AB pays a 5% dividend?

Diodes Inc is a massive growth story. I'm late to the game but many think that there is still plenty of upside. I bought it when the chart closed the gap the other day. The big drop on high volume was caused by the company anouncing that they would take on 200 million in debt for possible acquisitions. They will only be paying 2.25% in interest for the loan, which is due in 2026. You can get savings accounts with higher rates than that.

Tuesday, October 10, 2006

Upcoming Earnings for Flotek Ind.

Yes, that's right...I'm talking about FTK again. We are seeing the accumulation of the stock prior to earnings again. Remember that management has made some pretty big predictions about earnings for the second half of the year. The money coming in and out of the stock makes me think that someone is accumulating while someone else is still pissed about management's mistakes this past year.

I have been complaining about some seller out there continually pushing the stock down with 1k block sales. On Oct 4th there was a huge trade (huge for FTK) for about 25k and ever since it looks like someone is accumulating rather than the previous distribution. I keep seeing bids at 14.50. We have seen this before and it seems to come just before earnings. Someone has to be willing to sell at these low prices and I think it is because that they are still mad about the big acquisition that fell through earlier in the quarter. Good riddance. This stock is at a bottom and has nowhere to go but up.


Here is a chart. Look at the flat, small spread periods of accumulation prior to earnings. The technical indicators pick up on this a little bit. I'm not a big candlestick guy, but look at the Morning Star reversal pattern at Sept 18th. I also point out the time when FTK cancelled its ENERCOM presentation because doomed negotiations were still going on. That was a big mistake!!!

Tuesday, October 03, 2006

I don't understand this chart


Yesterday I posted some remarks about the lack of small and micro cap participation in this "rally". I wanted to follow up the post with a chart of the AMEX composite.

This chart look ominous. The weekly tried to make new highs on dramatically smaller volume, then turned down and now has broken the 40 week moving average. Overall, the AMEX looks to me like it has put in a double top.

What the heck does this mean? I have no idea and I can't seem to find any information about it either. All I know is that the AMEX has made a fantastic run in the last few years and it looks like the good times are over. Will the NYSE and Nasdaq follow? We shall see, but I'm going to continue to be cautious.
Go Dodger Blue!

Monday, October 02, 2006

Bear is back?

All the people that I read have been calling a top, at least for the short term. Most are pointing to the divergence between the large and small cap stocks. A great synopsis of the behavior is given by Asbury Research. Basically, the money moves to large, less risky stocks before a big slowdown in the economy.


Here are some of my charts. First is the S&P 500. Everything looks great. It is back above the trend line and its 40 week average.

Not so pretty are the small caps. Here I show the Russell 2000 growth ETF and the S&P 600. Both of these guys are still below their trend lines and seem to be having trouble breaking through.

So what am I gonig to do about this? My plan is to be a little more cautious for the time being. I also will keep a close eye on my long positions and not be afraid to close them before if they break to the downside. I'm also going to keep my eye open for some good shorts. This market just sucks and I'm starting to think that I should just wait for another big downside move before I buy again.


On a political note, I'm getting pretty tired of people saying that the market is stalling because the democrats might win congress back. What a bunch of crap!