Friday, July 28, 2006

Material cyclicals give false hope.

While moving today I heard from Chuck that the market was up big and FTK was down a bit (you can't go up 25% everyday). I knew GDP was released today and waited to get to my final destination before trying to find out what the nation's growth was.

Upon hearing that the market was up big I instantly assumed that the GDP number was in-line or greater than expected. I also assumed large volume would be involved because I feel the smart money fears an economic slowdown more than anything else. I instantly started to reassess my bearish stance and thought of new stock screens and possible small cap candidates (I think AFAM is interesting, BTW).

Well low and behold I found out that growth was less than expected and volume on the gain was rather weak. Rather than questioning my bearish outlook, I was now starting to feel that my predictions for my short candidates (TIE, X, PD and other cyclicals) were really starting to look good. All of these are now near or above their 50 dma. Remember to not short until 5 to 7 months after the peak and to wait until 3 or 4 50 dma price breaks.

I'm tired from moving, and I'm going to bed.

Wednesday, July 26, 2006

Big move in Flotek Industries (FTK)

I'm long on FTK and have been for some time. I got caught with my pants down after their last earnings report. Their eps was 0.19 and represented a slight decline from the same quarter last year. The explanation was that because of their growth, their tax burden increased from 9% to 35%. I took them at their word and thought that we would see a bit of a selloff, but not too drastic. I sold at my break-even point and then jumped right back in a couple days later at 23, thinking that this was the bottom. Never catch a falling knife!!! Never catch a falling knife!!! Never catch a falling knife!!! After listening to the conference call for the second time it was clear that there had been some problems in execution and that was probably the real reason why the stock sold off. The beginning of the market correction didn't help either. Oh well, another valuable lesson learned.


Check out the chart and see the pain I've endured ever since. I had faith in the companies long term growth and decided to take the pain instead of take the loss. Well, we had a nice pop today on absolutely no news. I wonder if someone knows something? There has been a really big deal in the works for a while and I wonder if there is big news to be released soon.

Tuesday, July 25, 2006

Why I'm writting the blog

The main reason why I'm writting about my thoughts regarding the market's daily movements is to force me to really analyze why I'm making certain trades and investments. As you probably can guess, being in science means that there are very few people that I'm can discuss my investment ideas with. This is a problem because I know full well from my own experience that one only truely understands something when one is able to teach it to another person. That's the nice thing about blogs, I can pretend to teach someone the things I've learned, even though I doubt that anyone is listening (except for Becky, hi Becky!).

I'm moving soon, so my blog entries will not be as often for a while. I hope I don't miss anything.

Put/Call Ratio and VIX

Like the AAII sentiment survey, I present the actual CBOE Put/Call ratio (dotted line) and the FFT smoothed Put/call ratio along with the S&P 500. The VIX data is much less random and noisy, so I don't bother to smooth it. First of all, I like the data, as it represents real actual buying patterns of people who are more like to be characterized as "smart money".

There seems to be a recent shift in the volatility (VIX) pattern after the 2003 bottom. I'm not sure why this is the case so I will concentrate on times after this drastic change in trend. It could be the fact that the way the VIX was calculated was changed in 2003.

Let's look at more recent plot of the VIX and Put/Call ratio.


What I find very intriguing, as opposed to the AAII sentiment survey, is the spike and then peak in the early stages of a correction, followed by a roll-over down to lower levels. For the VIX, this pattern happened before each of the last 4 market correction bottoms (marked by a blue dotted line). The Put/Call ratio also seems to have the predictive power of the VIX, with the exception of some premature spikes that gave false bottom signals.

The two plots above seem to have a much better bottom calling power than the AAII sentiment survey. I think by also taking the macro-economic situation into account, one can make some great bets on calling the bottoms of markets. Certainly a much better bet than using the AAII data.

I will leave the interpretation of the current VIX and Put/Call readings to the experts, but I will say that I would be a buyer of stocks if the macro situation wasn't so grim.

I want you to know that my bearish outlook on the market is not set in stone. My sentiment will change, along with the title of my blog, when the signs are there. Check out the Barry Ritholtz piece about this very topic. Strong opinions, weakly held

Monday, July 24, 2006

Sentiment arguments abound

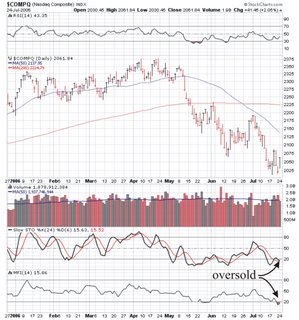
As I am relatively new to the market, with this being my experience with a downtrend. It is also my first exposure to people relying on contrarian market sentiment arguments for calling bottoms. I think I remember Jim Cramer screaming about how the New York Times had a story about the bad market on its front page so everyone should run out and buy, buy, buy. This was around May 15th, oops. Jim isn't the only offender though. I keep reading how market sentiment is so bearish we must be at a bottom, but still the market goes down.

Here is a post from Helen Meisler on June 16th.


Yesterday I showed the chart of the Investor's Intelligence percentage of bulls and how it was in an area of a bottom. Today I want to show the American Association of Individual Investors chart. What I find fascinating is that the percentage of bulls did not fall from last week to this week (26% both weeks), but those folks who are bearish jumped ship from the correction camp, as bears jumped 10% to 55%. The first one came days before the July 2002 low. The second one came at the October 2002 low, and the third one came in February 2003, three weeks before the March 2003 low. Obviously each time led to a rally that lasted longer than a few days. I'm sure some of you will question Thursday's trading volume and do what I normally do, noting how light it was compared to the down days. But I am going to point out that while it might have been light, it was surely heavier than volume during March and April, when I was complaining about volume on a daily basis and the bulls thought I was crazy to be doing so So if you liked the market this past spring, and didn't mind the volume being so low, then how can you complain about 1.9 billion shares traded on the NYSE yesterday vs. 1.5 traded in April? (And let's face it, the NYSE was where all the action was this spring, not in the Nasdaq, which couldn't keep up with it or with the S&P 500.) It is entirely possible we still need to do more retesting next week -- in fact, I would like to see some retesting early in the week -- but the indicators all say we've got a bottom for now.


Here is a post from Helen Meisler on July 20th.


I have been harping away about not having enough bearish sentiment, so I wanted to share with you that the American Association of Individual Investors just reported the results of its weekly survey, and finally we have a sentiment gauge that is extreme! The bulls are at 23.85%, the lowest percentage since April 2005. The bears are at 57.9%, the highest percentage since February 2003. Sometime later this morning, the charts should be available for you to see the statistic in graphic form.


I really enjoy reading Mark Hulbert and really appreciate the service he provides on MarketWatch.com. He looks at a different sentiment indicator obtained from the newsletters he covers, the Hulbert Stock Newsletter Sentiment Index (HSNSI). In his latest post, Mark comes to a very different conclusion than Helen.


...But recent trends are worrisome: So far in July, the HSNSI has increased by 6.2 percentage points while the Dow Jones Industrial Average has declined by 222 points. It is rare, and bearish, for advisers to become more bullish in the face of a market decline. These recent trends reflect a marked shift in mood on the part of the average newsletter editor. Most newsletters quickly exited from stocks in the wake of the market's decline that began in mid-May, suggesting that this decline was more likely a mere correction than the beginning of a major bear market. But rather than continuing to view the market's glass as half empty, editors are gradually beginning to view that glass as half full. If this trend persists, it would suggest that the stock market must decline a lot more before there is enough skepticism to support a more sustainable rally....


To be sure, the top performers are not more bearish than the bottom performers, so this contrast by no means supports an outright sell signal. Again, however, as with the first factor discussed in this column, the trends are not encouraging. I hope my discouraging assessment is proven unfounded.


How can two people, both using contrarian sentiment indicators come to different conclusions? Is the indicator really that useful? Why do I see sentiment arguments all over the place and why are they almost always wrong?

Like the title of my blog implies, I'm not very experienced with the market. I'm a trained scientist, a molecular spectroscopist to be specific, so I've spent many days of my life just staring at data and trying to pull unambiguous information from it, while still making sure that such information can stand up to peer review. So far I've been fairly successful in getting my papers published in quality journals and there are several more on the way. (Some papers are highlighted in the professional links section)

I decided to use my scientific background to look at the data. It occurred to me that I might be able to bring a different perspective to the interpretations of the AAII sentiment indicators.

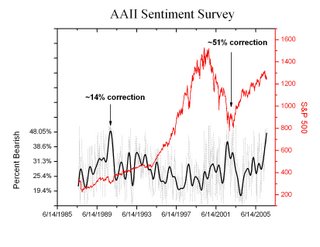
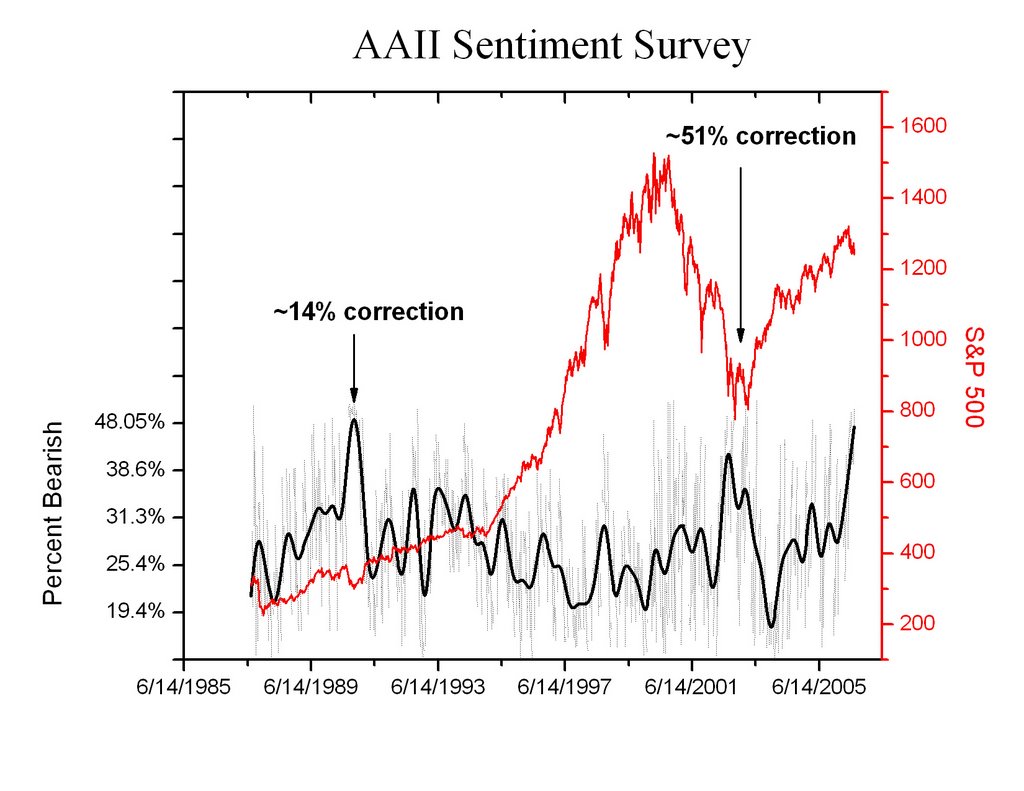
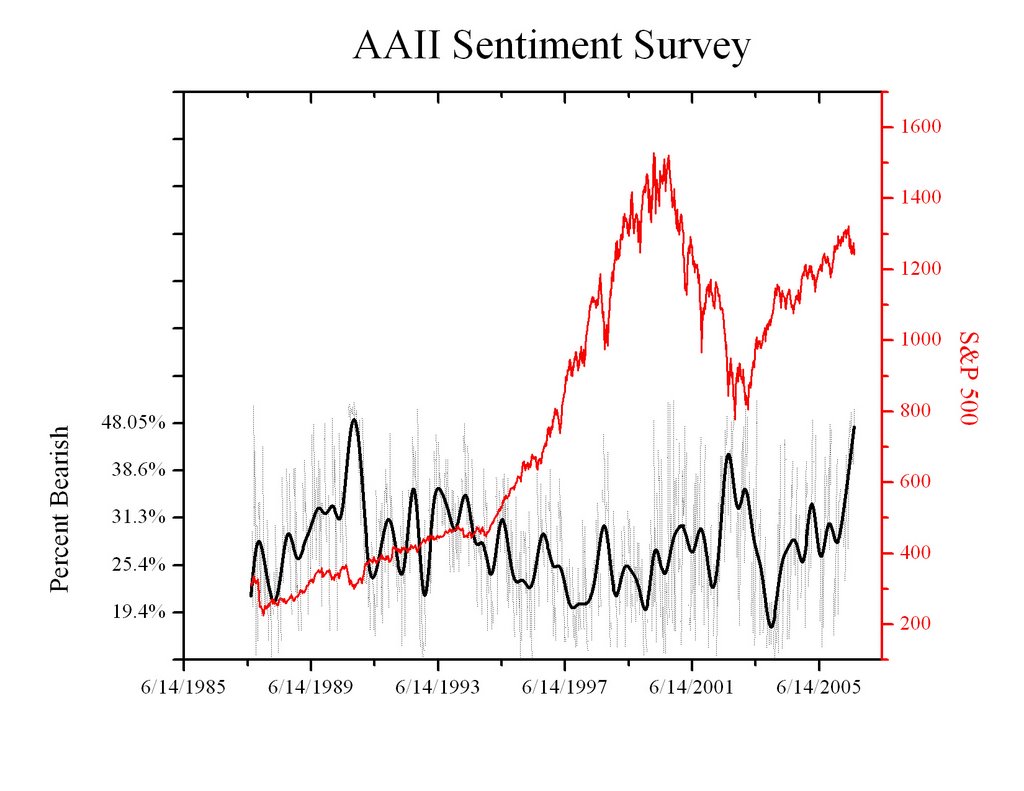
I created the figure using the actual AAII data (I had to pay for a 1 year membership). The dotted line is the actual weekly survey results and the smoothed curve is a Fast Fourier Transform (FFT) smoothing that removes Fourier components with frequencies higher than 1/n(dt) . I used n=20. All this does is remove some of the high frequency noise.

The first thing that really jumps out at me when I examine the correlation between the AAII sentiment survey (Percent Bearish) and a market bottom is the fact that there is absolutely no relationship between the magnitude of the market correction/bear market and the actual peak in the percent bearish survey. Consider the market bottom in 1990, which represented a correction of about 14%. The percent bearish was about 48%. Now look at the market bottom of 2002, which represented a correction of over 50%, the percent bearish was less than the 1990 high.

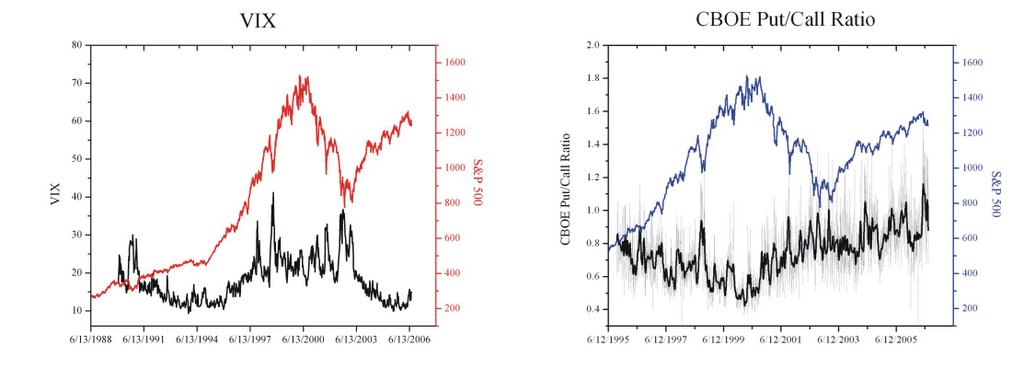
Ok, so what? If there is no correlation between the correction and the percent bearish peak, what use is the indicator? Well, we certainly can't say, "Oh there are extreme readings in the AAII indicator, so we are at a bottom" because there is nothing to say that the indicator can't go higher. As Helen found out above. The only thing the sentiment indicator is good for is being able to pinpoint the exact moment in the past when the market bottomed and kick ourselves for not buying. Looks to me that William O'Niel's method of spotting bottoms is still the best and most robust, as it relies on market action and volume. He does recommend looking at the Put/call ratio and I'll post a quick analysis on that later.

Look at the percent bearish now! It is higher than the bottom of 2002. I doubt we are done going down since the economy is just beginning to show signs of a slowdown. But I guess if you keep claiming that we have hit bottom everytime the sentiment spikes you'll get right eventually.

Finally, let me point out that there is nothing to stop the indicator from having percent bearish readings into the 80%-90% range. It is unlikely, but considering how screwed up this country and world is getting, being bearish on the stock market might soon be par for the course.

Update July 25, 2006

I had another thought about the AAII sentiment survey last night. Remember when some Boston Red Sox hacker tried to flood the 1999 All-Star ballots with votes for Nomar Garciaparra? He cast some 25,000 votes just before the close of voting, trying to guarantee a victory over Derek Jeter. I know this is probably not happening, but with so many people relying on this sentiment survey, what is to stop someone from trying to manipulate the market by flooding the AAII survey with overly bearish sentiment?

Just a thought. And another thing, why would anyone use the AAII sentiment survey over the newsletter sentiment? The newsletter people are the experts and presumably control the flow of more money than the average retail investor.

Short the rally in the morning?

That is the question I'm asking myself today. I'm not exactly sure why, but last Wednesday's rally just felt like shorting the next morning was the correct call and I made it without hesitation. There were all the telltale signs, with the volume low and according to some oscillators, the market was oversold.


What about today's rally? Again, the volume was weak (IBD) but it looks like we aren't oversold anymore, at least in the daily Dow and S&P charts. Maybe another reason why I'm thinking this rally won't immediately fail is because all the short candidates I'm following look as if they will attempt to retest their 50 dma. Therefore, I'm not going initiate any shorts tomorrow morning. Actually, looking at the Nasdaq, I'm thinking about buying some qqqq calls for a quick trade. Here are my reasons.

  • The slow stochastic is oversold
  • Money flow index is oversold
  • Sandisk exploded after-hours and I think that might bring in some buyers/chasers. Also, SIRF reports after the close tomorrow and it might be worth betting on a similar reaction. That chart is just as ugly as Sandisk's was.
    I don't know...I'll wake up early tomorrow and decide.

Update July 25, 2006

I just wasn't feel'n it. No buys today. SIRF is up >4% though.

After hours update: SIRF is tanking! Too bad I didn't make that trade today. It would have felt good to get a 3.2% gain in a day just to watch it dive after the close.

Phelps Dodge (PD) Option Trade is Closed

Purchased the Oct 75 Puts @ 4.30. Thanks, in part, to the mild copper selling panic in China overnight, I sold my puts for 5.30. That is a 23% gain. If there is a pop due to positive earnings tomorrow, maybe I'll bet against PD again. Looks like another short covering rally today. Here are some possible shorts after this rally dries up.


  • Sirf is up 10%

  • Akamai Tech is up 6%

  • Titanium Metals is up 6%


I got to tell you, the Sirf chart looks attrocious!  They report earnings tomorrow, too.  The Aug 25 Puts looks pretty good if there is a rally off of a good report. 


Sunday, July 23, 2006

US Steel (X) Base Failure

US Steel (X) reports earning on Tuesday. I wonder what will happen.

My guess, good or bad news, is that X will eventually bounce off of the support of the prior low and make another attempt at the 50 dma. After missing out on that last shorting opportunity, I plan on shorting after every rally above the 50 dma. Posted by Picasa

Update-July 24, 2006 US Steel is downgraded by Bear Stearns and the price shoots up. Hmm...looks like another short covering rally as X bounced off of its 200 dma.

Freeport-McMoRan (FCX) on the watchlist


Freeport-McMoRan is showing the signs of being a great short candidate. Here's the technical checklist.

  • Head and shoulders with climax and island top!
  • Increasing volume as head and shoulder progresses.
  • Wedging.
  • Decreasing relative strength.


It's still too early to short, but keep your eyes on this one. Look for another drop and then rally back to the 50 dma.

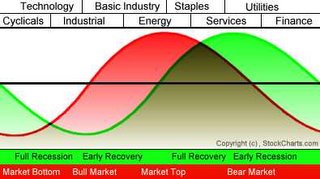
I think it is useful to remember the rules of sector rotation now that it looks like we are headed for a downturn in the economic cycle. Check out the sector rotation model.

This cycle is why it is said to sell the cyclicals at their cheapest and buy at their most expensive. Most experts know this but sadly the common investor just looks at the P/E and growth of these stocks and assumes that there is no where else to go but up. Sadley, these folks are going to get killed when the smart money follows the playbook while they continue to mount losses. Just look at this post I found on the FCX yahoo message board. I hope he doesn't average down as he goes.

With forward PE down to signle digit with over 50% revenue/earning growth, FCX
is certainly the best among gold bugs. By wall street standard, FCX can have PE
between 50-100 with 50% growth. How the heck FCX not moving up is really beyond me.

Phelps Dodge (PD) Trade

I purchased some out-of-the-money put options the morning after that big short covering rally on Wednesday, July 19th. I expect PD to rally again and try to get back above the 50 dma so I'll probably sell those puts on Monday. I like the way the chart is developing so I'm sure I'll be making some more trades on the short side. I know you're not supposed to short a stock untill 5 to 7 months after the absolute top, but I just couldn't resist after that massive rally on Wenesday. What really sucks is that I narrowed my put buy list down to Phelps Dodge and US Steel late that Wenesday night. I went with PD and now I'm sitting on a 8% gain. That gain would have been HUGE if I would have gone with US Steel (X). Posted by Picasa

Cisco Systems


Like I've said, I base my shorting strategy on William O'Neil's book. In it, he and Gil Morales give a checklist of technical action that one should look for when shorting stocks. They provide a few examples and I've reproduced one of them here. It is Cisco Systems just before the bubble burst.


  • Look for a head and shoulders top. A gap island top is a bonus
  • Don't short at the "obvious" point. You'll get stopped out
  • Look for rallies on weaker volume, or wedging
  • Wait for 3 or 4 rallies above the 50 dma. This is probably the hardest call. I think the best bet is to short after the second rally and if you get stopped out, just try again after the next price break.
  • Don't make the obvious short sale when price breaks the neckline.
  • Wait 5 to 7 months after the absolute top before shorting.
  • Don't short stocks with small floats. The more stocks splits the better!
  • Most importantly, make sure the market is in a downtrend.

Saturday, July 22, 2006

Check out the first comment.

In addition to being a novice bear, I'm also a novice blogger so it was a pleasent surprise to come home today and see that I had a my first comment. I hesitated to read it because I guess I was expecting some sort of rude comment about my blog or how I should stick to my day job. Given that I just got back from a long, hot day of drinking with friends (I've since sobered up) , I figured I was in the perfect state of mind to take insults from some random weirdo.

So, what did the comment say? It was a quick note from the Barry Ritholtz, saying that he appreciated the kind words. How cool is that? Thanks Mr. Ritholtz!

Also, I was searching for some other people's opinions on Titanium Metals (TIE) and I found a great call by Yasir Anwar.

Consider selling TIE short as soon as it trades below $31.10, with a stop loss
order at $32.10. Look for a $1 to $3 drop in the stock price.

July 10

TIE closed at $24.77 on Friday. Great call, Yasir!

Friday, July 21, 2006

TIE Titanium Metals

Holy cow, I'm researching short candidates and Titanium Metals has it all. There is the climax top in early May, the excess in supply due to all the recent stock splits, and high volume down days. Look at its attempt to recover on weaker volume.

It is just a bit too early to short. According to William O'Neil, the best time to short is 5 to 7 months after the absolute top. I'm going to wait for another rally attempt back up to the 50 dma and then its time to short.

The only thing that worries me is the M&A activity that is going on in the materials sector. I think TIE is too big to be an acquisition target, however. Posted by Picasa

Copper's chart

How about this chart. Looks like a ticking time-bomb to me. I've already purchased Oct 75 puts at $4.30 for Phelps Dodge (PD). I'm waiting for Southern Peru Copper (PCU) to break its 50 dma and then I'll short it.
Posted by Picasa

My inspiration in this bear market

I'll start things off with one bit of advice. The one thing I learned relatively early was never listen to James J. Cramer. His recommendations almost killed me before I even really got started. I won't go into detail here given that there are plenty of Cramer bashing blogs out there and we don't need another. Let's not get sidetracked here. My point is that his site (http://www.thestreet.com/) did find me my first market inspiration, namely Barry Ritholtz. (http://bigpicture.typepad.com/). He has really opened my eyes to many things going on in the market and kept a steady stream of great information on his blog.

My second influence in my bear market style is William O'Neil. Oh yes, the king of CAN SLIM! I have based my shorting style on his book "How to Make Money Selling Stocks Short". Although I absolutely abhor his politics, one can't argue with his investing record.

My shorting thesis is this:

The Macro argument:

  • The economy is slowing down
  • We have high, inflation fighting, interest rates and a hawkish Fed.
  • The yield curve is inverted.
  • Consumer spending will decline in with the rise of high energy prices
  • Housing market is tanking

The Market's history:

  • Previous market leaders go down in flames in the subsequent bear market
  • Cyclical stocks lead towards the end of bull market
  • Cyclical stocks lead the market down in the bear market

I'll be using technical analysis to present my shorting opportunities.

Simple, eh?