
Put/Call Ratio and VIX
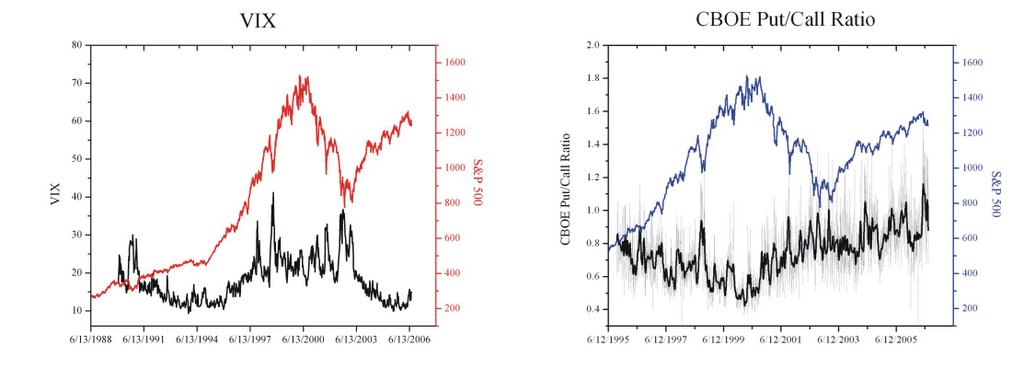 Like the AAII sentiment survey, I present the actual CBOE Put/Call ratio (dotted line) and the FFT smoothed Put/call ratio along with the S&P 500. The VIX data is much less random and noisy, so I don't bother to smooth it. First of all, I like the data, as it represents real actual buying patterns of people who are more like to be characterized as "smart money".
There seems to be a recent shift in the volatility (VIX) pattern after the 2003 bottom. I'm not sure why this is the case so I will concentrate on times after this drastic change in trend. It could be the fact that the way the VIX was calculated was changed in 2003.
Let's look at more recent plot of the VIX and Put/Call ratio.

What I find very intriguing, as opposed to the AAII sentiment survey, is the spike and then peak in the early stages of a correction, followed by a roll-over down to lower levels. For the VIX, this pattern happened before each of the last 4 market correction bottoms (marked by a blue dotted line). The Put/Call ratio also seems to have the predictive power of the VIX, with the exception of some premature spikes that gave false bottom signals.
The two plots above seem to have a much better bottom calling power than the AAII sentiment survey. I think by also taking the macro-economic situation into account, one can make some great bets on calling the bottoms of markets. Certainly a much better bet than using the AAII data.
I will leave the interpretation of the current VIX and Put/Call readings to the experts, but I will say that I would be a buyer of stocks if the macro situation wasn't so grim.
I want you to know that my bearish outlook on the market is not set in stone. My sentiment will change, along with the title of my blog, when the signs are there. Check out the Barry Ritholtz piece about this very topic. Strong opinions, weakly held


No comments:
Post a Comment