Tuesday, November 28, 2006

Get inside Cramer's head

Scary thought I know. You have to read the exchange between CXO Advisory Group and Jim Cramer. It is well worth your time.

Cramer is easily the most inconsistent "pro" out there and it doesn't take long to figure that out. What I find so strange is that he seems to be the only one who doesn't realize it. To his credit, he seems to have stopped recommending thinly traded stocks that move wildly in after-hours trades.

Exciting technicals - Mitcham Industries (MIND)

Most of the stock screeners out there are really geared towards the mid- and large-cap equities. It is hard to find a screen that allows one to discover new and relatively unknown stocks.

My favorite is the MSN Money stock screener. I have a CANSLIM screen for the fast growing companies based upon the criteria of William O'Neil. I also have a screen that I came up with that has the purpose of spotting stocks with increasing revenue but rather weak stock performance. It was basically modeled after the recent behavior of Flotek Industries. Durning the course of Flotek's growth, it was hit with a massive increase in its tax burden. The revenue was still growing (100% year of year), it was the EPS that went flat. As a result, the stock price took a nose dive.

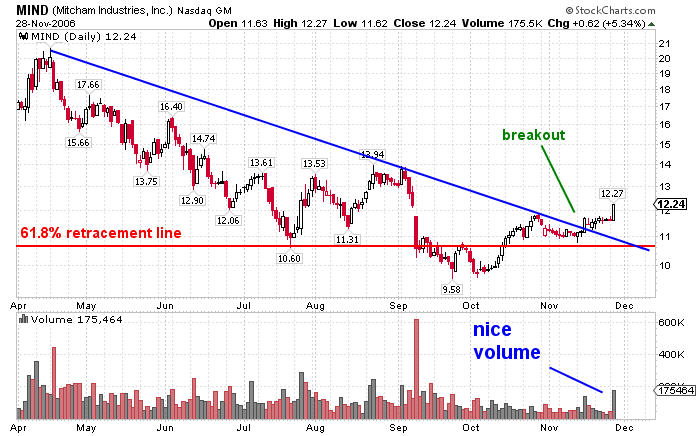
The charts on the left are a daily, weekly and monthly of Mitcham Industries Inc.. This stock popped up on my simple revenue screen with the following numbers. They lease seismic survey equipment.

Rev. growth Qtr vs. Qtr - 56.50%

Rev growth Year vs Year - 31.20%

Return on Equity - 26.49

EPS Growth YTD vs YTD - 38.80%

Gross Margin - 64.30


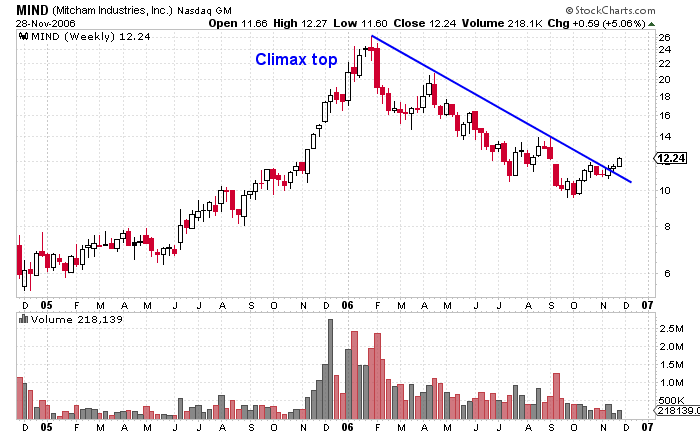
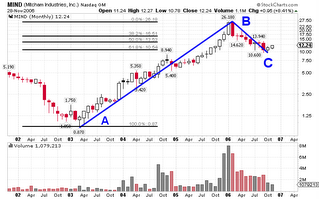
Well, those are the fundamentals. What I'm excited about is the technicals. I've been watching for a while now and today we had a breakout today on pretty good volume. This is coming off of another breakout on November 15th that broke a long term downtrend channel line going back to Feb 2006. (See weekly chart) The really cool thing is the long term pattern. Look at the nice ABC pattern that is taking shape on the monthly chart. The A point is way down at 0.870. The stock then makes a huge run in three years to the B point of 26.18 (It finished with a climax top). The stock then retraces 61.8% to the C price point of around $10.

My price target is $25. If the stocks picks up some volume as it nears the highs (26.18), hold on to your horses because this might just go a lot higher. It will have to get more than 8 million on the monthly or 2.8 million on the weekly.

Monday, November 27, 2006

Sit back and watch

Big drops like today are so much easier to take when one has money on the sidelines waiting to be put to work. Unfortunately, some of this money was put to work a little too early. I had put in an order to buy Lam Research Corp (LRCX) after the recent breakout last week. I was down in the lab all day and didn't see the big sell off today. Needless to say, my limit order was filled at 54.05. Oh well. I put in a stop loss at 51.90. I doubt it will hold. It looks like we are in for a nice pullback and LRCX is bound to get a lot cheaper.

Flotek (FTK) dropped less than 1% on very light volume. Very Bullish. I'm tempted to buy more very soon.


AllianceBernstein (AB) pulled back 2.56% on moderate volume. It looks like it might get down to area 72.50, where there is nice support. The bullish sign for AB is found in the 5 min chart. It make its largest price decline on the lowest volume of the day and then rebounded somewhat on heavier volume. I like that.


Gold is up nicely the last few days. I originally purchased shares of the gold ETF because I'm worried that inflation is worse than is generally accepted. The dollar weakness has definitely helped this position.

Monday, November 20, 2006

Bottom Feeding with GNSS


Because I'm looking for a market decline I'm on the lookout for stocks that are already near their bottom and also near support. Check out Genesis Microchip (GNSS). I give the daily and weekly charts. The price is very near long term support at just under $10. We also had a climax bottom on Oct 25th, which usually means that all the sellers are gone. If GNSS continues down to the support line on low volume I think I'll pick up some shares.

Finally, I closed my ECIL short a 7.80 today. It wasn't doing what I predicted so I got out with a very small gain. Better than a loss, eh? Especially considering it got up to $8.15 later in the day.

Jim says "buy, buy, buy!!!"


Like I said in my first post, there are enough Jim Cramer bashing blogs out there already and the world doens't need another. I would bet that without Cramer there would be some blogs with posts that are as sporatic as mine. With that said, I noticed a couple of big-time sell signals today on RealMoney.com. The first takes advantage of Cramer as a contrarian indicator. Today, when the market dropped, he called for people to "Shop this Dip". Uh oh, sounds a lot like the calls Jim made back in May. The second came from a word of caution from Cody Willard, who called the top back in May.

Looks like that pullback that people have been looking for might be just around the corner. I hope so, because I want to put some money to work.

Saturday, November 18, 2006

Correction


I was in the bookstore last night and was reading a tech. analysis book by the guy who invented the MACD indicator. He pointed out that the VIX is useful for calling bottoms but has found no correlation between the market tops and extremely low volatility.

Today I also found an interesting link on The Big Picture's linkfest. It was an article by Mark Hulbert, whom I read regularly, so I was surprised that I missed it. "How low can it get?"

Finally, if you didn't know, anyone with an email ending in .edu can get a free RealMoney.com membership until March 07. Pretty cool, as long as one ignores that Jim Cramer guy. I like Rev Shark and Cody Willard, but don't pay attention to the technical analysis guys. They really suck. I don't see many post by Barry Ritholtz anymore. Too bad, because he used to be a nice contrast to all of the perma-bulls on the site.

Friday, November 17, 2006

This all very interesting...but


This market is maddening!

With some money on the sidelines, I have been looking to enter new positions ever since the S&P 500 was at 1320. We are at 1403! If I'm feeling this way, just think about the people who have been 100% in cash for this whole run. Now I understand why people say that we hit the top when the bears finallly capitulate. When they finally say "screw it" and jump in on the long side there will be no where to go but down.


I'm like to remind myself of a Jesse Livermore quote when I'm having trouble being diciplined.

“After spending many years in Wall Street and after making and losing millions of dollars I want to tell you this: It never was my thinking that made the big money for me. It always was my sitting.”

Friday, November 10, 2006

I'm learning my ABC's


In a market when all of the leaders have broken out of bases, like now, it is useful to look for patterns that can give clues to making shorter term trades. I've been reading a lot recently on Elliot Wave "theory" and have decided to test it out. Elliot wave uses Fibonacci's golden ratio to predict the future price of stocks, bonds, commodities, etc.

Tom O'Brien talks a lot about the ABC structure based upon the Elliot wave, but as usual, he adds price and volume action along with the ABC. I've been watching tons of charts and it looks like ECIL is worth a try. Looking to the chart in June and July, Ecil completed two ABC down structures. Notice the fractal nature of the ABC's. After these moves down, Ecil rebounded on relatively weak volume and then took a big hit on big volume in October, forming another A to B price movement. The price then retraced to the first Fibonacci level of 38.2% of the A to B leg, on much lighter volume. The price looks to have stalled and we should now begin the B to C movement down on higher volume, with a price target of < $6.

I'm sick of spotting these charts, predicting the move and then not having any money in the stock. Well, not here. I shorted Ecil yesterday at $8.90. I still expect an overall market decline, so this short position should put me in good position for the pullback.

Monday, November 06, 2006

QQQQ trade

Holy cow! Looks like today's rally didn't just catch me by surprise. I closed that QQQQ trade early this morning and took solace in watching FTK rise another 12%.

Saturday, November 04, 2006

A little publicity

FTK shot up another 11% yesterday thanks to some exposure by Jon D. Markman.

He is looking for Flotek to hit $40 in the next 18 months. He is probably being conservative. If they come through with another big quarter I would expect FTK to reach $40 within 6-8 months, depending on how many momentum players jump on. Also, we should expect some analyst coverage soon.

Friday, November 03, 2006

QQQQ Puts


I went and did it. The maket opened up this morning and I just couldn't resist buying some in-the-money QQQQ Jan 07 puts. I'm looking for a pullback to the 39-40 level.

Wednesday, November 01, 2006

Another great call by Mr. O'Brien

It looks like the pullback has begun. So what did I do today?

First, I sold out of DIOD at 43 this morning. It was lagging and considering the action today I really didn't feel like holding on to it during today's earnings announcement. It turned out to be a good decision. DIOD tanked later in the day and didn't bounce very much after it reported great numbers.

AllianceBernstein (AB) hit a new 52-week high and then backed off slightly. I really like the way this one is acting. I will hold onto this one and will probably add more shares if the market weakness brings it down.

Flotek Industries (FTK) What can I say about this one. I've been through hell with Flotek and certainly won't be shaken out with a little market weakness.

I was one click away from buying some qqqq March '07 puts at the 44 strike price. I probably should have but just didn't have the guts. If the market opens up big tomorrow I still might make the trade.


Instead of buying puts I decided to buy some of the gold ETF (GLD) as a hedge against the market decline. Why? Check out the chart. Gold broke out of a symmetric triangle pattern. Also, 'ol Tom O'Brien has been preaching about gold for a long time and today looks like a great entry point.