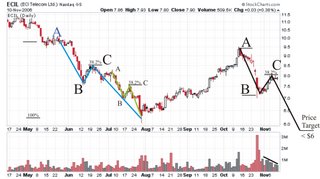
I'm learning my ABC's

In a market when all of the leaders have broken out of bases, like now, it is useful to look for patterns that can give clues to making shorter term trades. I've been reading a lot recently on Elliot Wave "theory" and have decided to test it out. Elliot wave uses Fibonacci's golden ratio to predict the future price of stocks, bonds, commodities, etc.
Tom O'Brien talks a lot about the ABC structure based upon the Elliot wave, but as usual, he adds price and volume action along with the ABC. I've been watching tons of charts and it looks like ECIL is worth a try. Looking to the chart in June and July, Ecil completed two ABC down structures. Notice the fractal nature of the ABC's. After these moves down, Ecil rebounded on relatively weak volume and then took a big hit on big volume in October, forming another A to B price movement. The price then retraced to the first Fibonacci level of 38.2% of the A to B leg, on much lighter volume. The price looks to have stalled and we should now begin the B to C movement down on higher volume, with a price target of < $6.
I'm sick of spotting these charts, predicting the move and then not having any money in the stock. Well, not here. I shorted Ecil yesterday at $8.90. I still expect an overall market decline, so this short position should put me in good position for the pullback.


No comments:
Post a Comment