 Most of the stock screeners out there are really geared towards the mid- and large-cap equities. It is hard to find a screen that allows one to discover new and relatively unknown stocks.
My favorite is the MSN Money stock screener. I have a CANSLIM screen for the fast growing companies based upon the criteria of William O'Neil. I also have a screen that I came up with that has the purpose of spotting stocks with increasing revenue but rather weak stock performance. It was basically modeled after the  recent behavior of Flotek Industries. Durning the course of Flotek's growth, it was hit with a massive increase in its tax burden. The revenue was still growing (100% year of year), it was the EPS that went flat. As a result, the stock price took a nose dive.
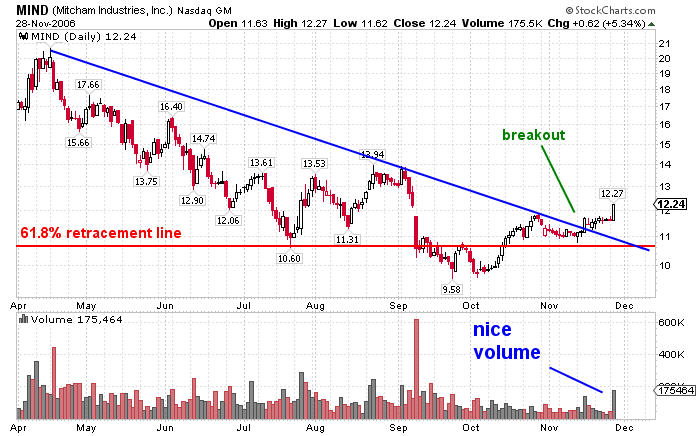
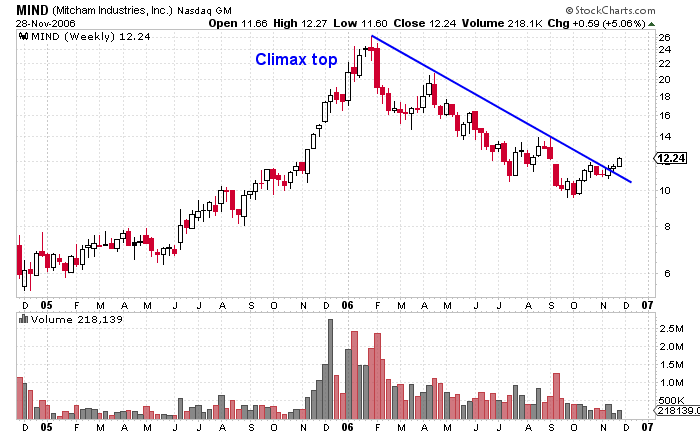
The charts on the left are a daily, weekly and monthly of Mitcham Industries Inc.. This stock popped up on my simple revenue screen with the following numbers. They lease seismic survey equipment.
Rev. growth Qtr vs. Qtr - 56.50%
Rev growth Year vs Year - 31.20%
Return on Equity - 26.49
EPS Growth YTD vs YTD - 38.80%
Gross Margin - 64.30
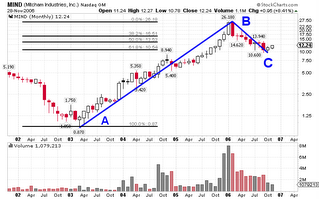 Well, those are the fundamentals. What I'm excited about is the technicals. I've been watching for a while now and today we had a breakout today on pretty good volume. This is coming off of another breakout on November 15th that broke a long term downtrend channel line going back to Feb 2006. (See weekly chart) The really cool thing is the long term pattern. Look at the nice ABC pattern that is taking shape on the monthly chart. The A point is way down at 0.870. The stock then makes a huge run in three years to the B point of 26.18 (It finished with a climax top). The stock then retraces 61.8% to the C price point of around $10.
My price target is $25. If the stocks picks up some volume as it nears the highs (26.18), hold on to your horses because this might just go a lot higher. It will have to get more than 8 million on the monthly or 2.8 million on the weekly.