PCE vs. The Dow
I would like to start off by saying that I'm not an expert in the field and I'm just presenting this data for my own good. Ok, with that out of the way I'll get down to business.
I was interested by a post on The Big Picture in which Barry Ritholtz asks, "Where are the Bears? (And why are the Bulls so insecure?)". It got me thinking about all the people out there who are predicting a massive collapse of the market (you can usually find these people posting comments on Barry's blog). It seems clear to me that we will see a pullback in the market, but a collapse? Usually these gloom and doom comments I read are based upon macroeconomic arguments or have some political bias, like George Bush is leading this country down the toilet. Now I happen to agree that Bush is an incompetent president that will go down in history as one of our worst, but I also believe that the United States is resilient enough to get through this dark period. Ok, before I really start ranting I'll get back to the question that I started out to answer for myself, namely, does the macro argument really matter?
The book "Ahead of the Curve" (recommended by Mr. Rithotz) analyzes the relationship between the economy and the market. The author, Joseph Ellis, basically narrows it down to the consumer. The relationship between the real personal consumption expenditure (PCE) and the market can be found on Ellis' webpage.
The relationship between economic slowdowns (led by downtrends in year-over-year consumer spending) and bear markets (vertical yellow bars) is remarkably consistent, though not infallible, over many cycles. Most bear markets begin (see circles) when the year-over-year rate of growth in consumer spending is peaking, and investor and general business optimism are at their highest! Considerable courage is required to reduce investments at such times.
 For my own learning purposes I reproduced the chart using the year over year percentage change in the PCE and the year over year percent change in the Dow Jones Industrial Average. Using the data from the Bureau of Economic Analysis I was able to plot the relationship all the way back to 1930. The red line is the PCE and the black is the Dow. The grey blocks at the bottom of the plot show bear markets and were defined by negative percent changes in the Dow.
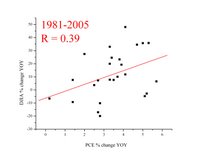
What is clear is that, indeed, there is a good correlation between downturns in the PCE and downturns in the Dow, up to a point. It seems that the correlation begins to wane after 1980. To get a more quantitative handle of this correlation I've also plotted the Dow vs. the PCE for the periods 1931-1980 and 1980-2005 and fit them to line. The R value in the plots are from the linear regression and is just a simple statistical tool for quantifying the degree to which two variable are correlated. A value of 1 means that they are totally correlated while a value of 0 means that there is no correlation.

 As you can see, the period between 1931 and 1980 has a relatively high R value (0.62). Conversely, the period between 1980 and 2005 has a much lower R value. So what does this mean? Clearly, the use of the PCE as an indicator to where the market is headed is not a good as it used to be. Of course a total collapse of the consumer will result in a downturn, but it is not clear to me that a decrease in PCE growth will lead to a market downturn. All you have to do is look at the early 90's for an example.
Another point I think that is worth noting is the low growth rates we are currently at. We are certainly not at the extreme PCE growth levels that were seen in the boom and bust cycles of the past.
Conclusions:
- The relationship between the PCE and the equity market is not a strong as it used to be.
- It is dangerous to base opinions of market direction solely on macroeconomic data.
- My opinion is that we are overdue for a pullback, but we are not looking at a crash.
- I'm looking for a S&P 500 pullback to the 1320 level.
- I'm probably wrong!


No comments:
Post a Comment